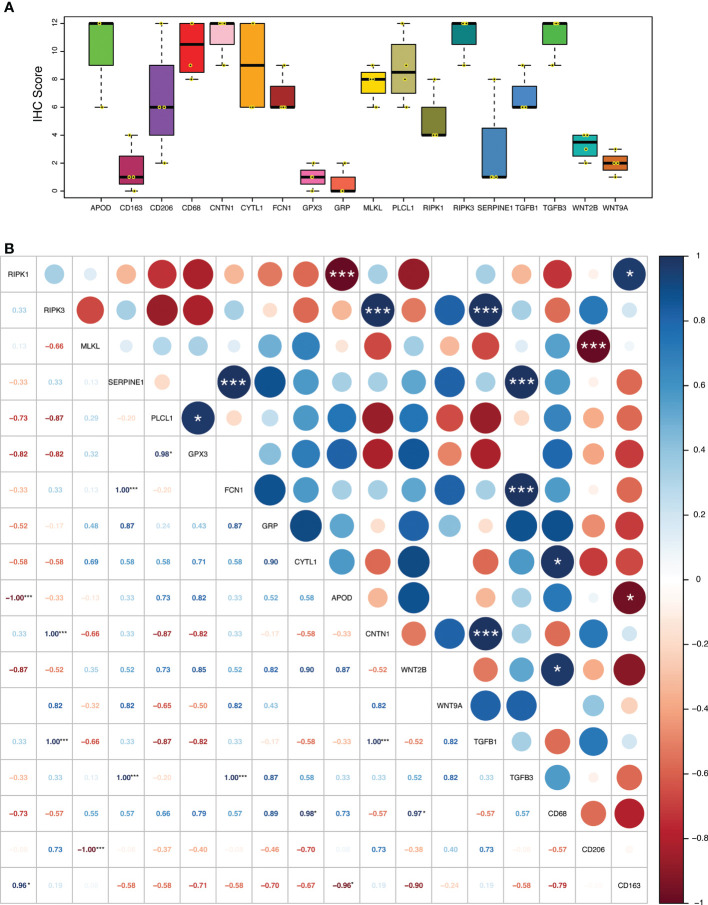
Figure 11.
(A) Expression level (IHC quantification) of RIPK1, RIPK3, MLKL (necroptosis core mediators), NRGPI oncogenes (SERPINE1, GPX3, GRP, FCN1, CYTL1, CNTN1, PLCL1, and APOD), and markers of WNT signaling pathway (WNT2B, WNT9A), TGF-β signaling pathway (TGFB1, TGFB3), and macrophage (CD63, CD206, CD163) in the clinical samples (n = 4) of stomach adenocarcinoma. The scattered dots represent the IHC score of each individual sample. The thick middle lines represent the median value and error bars indicate the standard deviation. The bottom and top of the boxes are the 25th and 75th percentiles (interquartile range), respectively. (B) A correlation matrix illustrating Pearson’s correlation coefficients indicating the relationship among expression levels of RIPK1, RIPK3, MLKL (necroptosis core mediators), NRGPI oncogenes (SERPINE1, GPX3, GRP, FCN1, CYTL1, CNTN1, PLCL1, and APOD), and markers of WNT signaling pathway (WNT2B, WNT9A), TGF-β signaling pathway (TGFB1, TGFB3), and macrophage (CD63, CD206, CD163) in the clinical samples (n = 4) of stomach adenocarcinoma. P values are shown as: *P < 0.05; **P < 0.01; ***P < 0.001.

