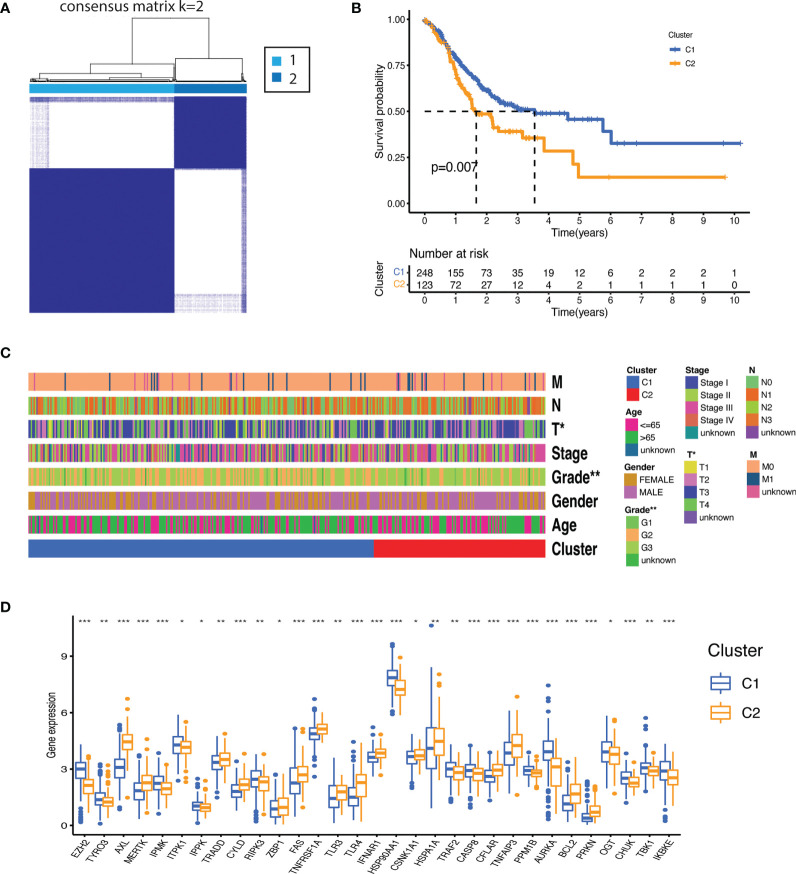
Figure 2.
Molecular subtypes based on the necroptosis-related genes expression. (A) Consensus clustering matrix (k=2) identified two clusters (C1 = 248; C2 = 123) based on the expression of the 55 NRGs. (B) The clusters demonstrated significant difference in overall survival (p<0.007). (C) Heatmap illustrating association between the clusters and their clinicopathological features of the gastric cancer patients (TNM staging. T: primary tumor; N: lymph node; M: metastasis. Degree of differentiation. G1: highly differentiated; G2: moderately differentiated; G3: poorly differentiated). P value are shown as *P < 0.05; **P < 0.01. (D) Distribution of NRGs expression between the clusters (P values are shown as: *P < 0.05; **P < 0.01; ***P < 0.001).

