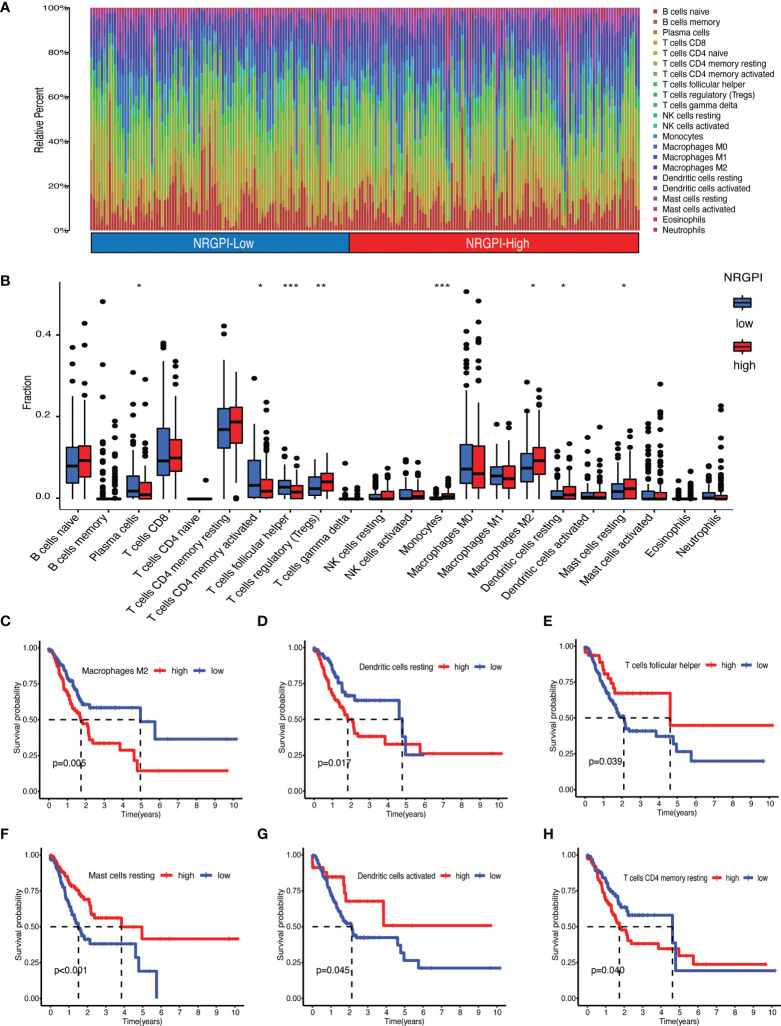
Figure 7.
Immune landscape assessed by CIBERSORT algorithm. (A) Heatmap and (B) bar plot of abundance of 22 subtypes of immune cells in NRGPI-High and NRGPI-Low subgroups (P values are shown as: *P < 0.05; **P < 0.01; ***P < 0.001). (C–H) Kaplan-Meier curves for survival difference between TCGA patients with high and low- infiltration of immune cells.

