Figure 8.
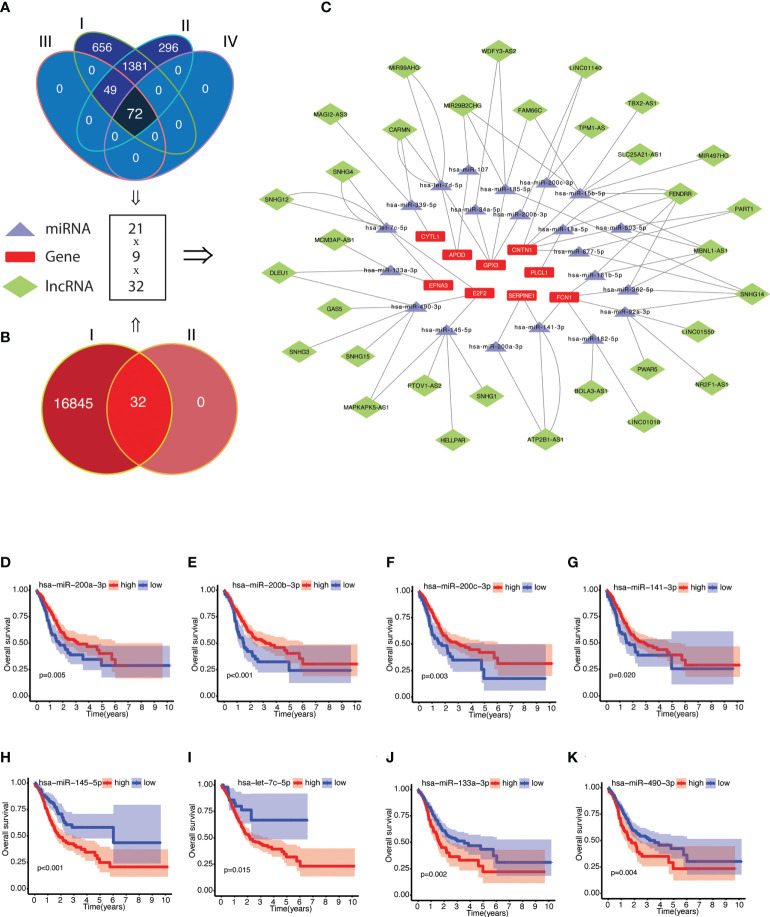
Construction of competing endogenous RNA (ceRNA) network of NRGPI genes. (A) Scrutiny of miRNA by (I) obtaining miRNA targets from miRWalk version 3.0 (n = 2158); (II) screening for miRNA expression in TCGA STAD cohort (n = 1798); (III) followed by gene-miRNA target correlation analysis (n = 122); and (IV) survival significance (n = 72). (B) lncRNA targets (n = 16877) were obtained for the 72 miRNA targets (I), which were then (II) screened for individual target-based correlation analysis (positive correlation with risk gene and negative correlation with miRNA). (C) A mRNA-miRNA-lncRNA (ceRNA) network (9 risk genes-21 miRNAs-32 lncRNAs) was constructed. Kaplan-Meier curves of survival analysis for miRNA targets of NRGPI oncogene (D-G) and NRGPI tumor suppressor genes (H–K). Correlation was tested with Spearman’s correlation test with the following criteria: R=0.2 and p value <0.001.

