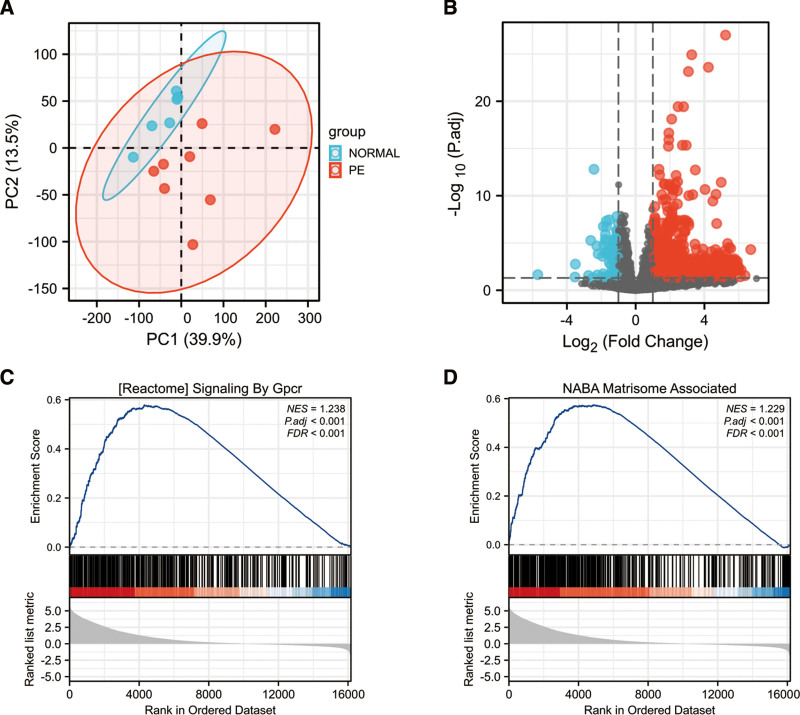
Figure 2.
The PCA analysis, the volcano plot of the identified DE-mRNAs and representative results of GSEA analysis in the gene expression data in GSE190971. (A) The visualization of principal component analysis for GSE190971. (B) Volcano plot of the identification of DE-mRNAs, including 1880 upregulated and 96 downregulated genes, Red, upregulation; Blue, downregulation. (C) The most significant enriched gene set correlated with the PE group was signaling by Gpcr (NES = 1.238, P.adj < .001, FDR < 0.001). (D) The second significant enriched gene set correlated with the PE group was matrisome associate (NES = 1.229, P.adj < .001, FDR < 0.001). DE-mRNAs = differentially expressed mRNAs, FDR = false discovery rate, Gpcr = G-protein coupled receptor, GSEA = gene set enrichment analysis, NES = normalized enrichment score, PCA = principal component analysis.

