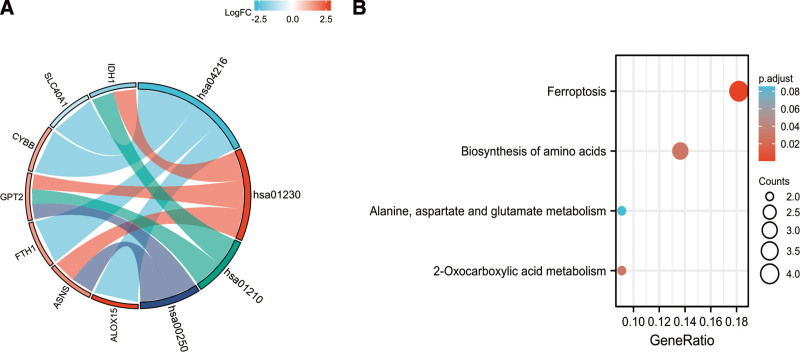
Figure 5.
KEGG of 26 ferroptosis-related DE-mRNAs, Chord (A) and Bubble plot (B) of enriched KEGG terms of 26 ferroptosis-related DE-mRNAs, Y-axis: name of the KEGG signaling pathway; X-axis: percentage of the number of genes assigned to a term among the total number of genes annotated in the network; Bubble size, number of genes assigned to a pathway; Color: enriched −log10(P-value). DE-mRNAs = differentially expressed mRNAs, KEGG = Kyoto Encyclopedia of Genes and Genomes analysis.

