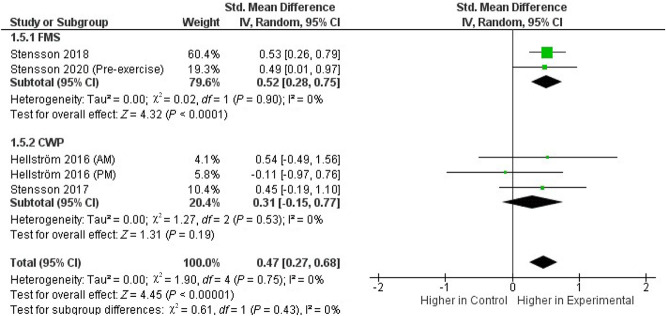
Figure 3.
Forest plot of Standardized Mean Difference (SMD) in plasma SEA levels in patients (FMS and CWP) and healthy controls. Weights obtained from random-effects analysis. Horizontal lines represent 95% CIs. The arrow indicates that the upper limit of the CI for that study is equal or superior to the upper limit of the SMD indicated at the bottom of the graph. The diamond shows the overall pooled SMD. The vertical line is the line of no effect, representing no difference between patients and healthy controls. CI, confidence interval; CWP, chronic widespread pain; FMS, fibromyalgia syndrome; SEA, stearoylethanolamide.

