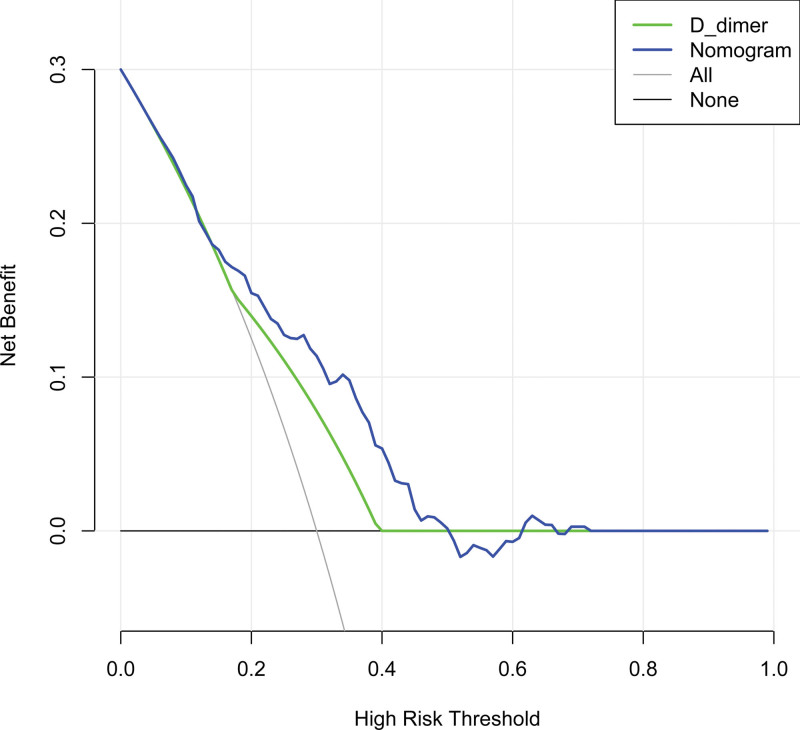
Figure 5.
Decision curve analysis for the DVT nomogram. Notes: The threshold range of net benefit of the nomogram was about 6% to 50%, while that of D-dimer was about 18% to 36%; the decision-making curve showed that when the threshold probability was 6% to 50%, this nomogram would increase the net benefit compared with the benefit of either the predict-all-patients as DVT or the predict-none-patients as DVT. DVT = deep vein thrombosis.

