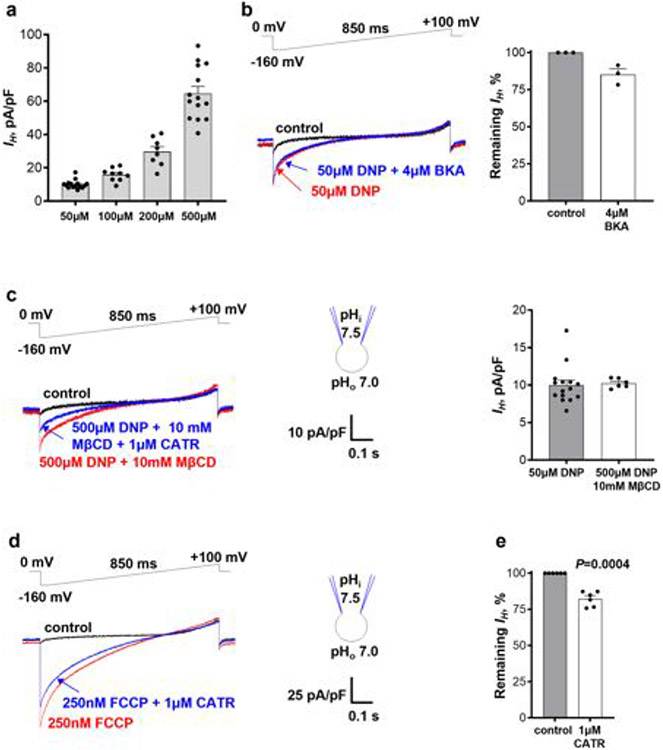
Extended Data Fig. 1 ∣. DNP- and FCCP-induced mitochondrial IH.
a, IH densities induced by different DNP concentrations in heart IMM at −160 mV (n = 15 for 50 μM, n = 9 for 100 μM, n = 8 for 200 μM, n = 14 for 500 μM). Data are mean ± SEM. b, IH induced by 50 μM DNP in heart IMM before and after application 4 μM BKA (left). Remaining fraction of IH induced by 50 μM DNP at −160 mV after inhibition by 4 μM BKA, n = 3 (right). Data are mean ± SEM. c, IH induced by 500 μM DNP on the background of 10 mM MβCD in heart IMM before and after application of 1 μM CATR (left). IH densities induced by 50 μM DNP alone (n = 15)and 500 μM DNP on the background of 10 mM MβCD (n = 6) (right). Data are mean ± SEM. d, IH induced by 250 nM FCCP in heart IMM was inhibited by 1 μM CATR. e, Remaining fraction of FCCP-induced IHat −160 mV after inhibition by 1 μM CATR. Control (100% IH) is shown in gray. Data are mean ± SEM. Paired t-test, two-tailed, control vs. 1 μM CATR, n = 6.

