Figure 2.
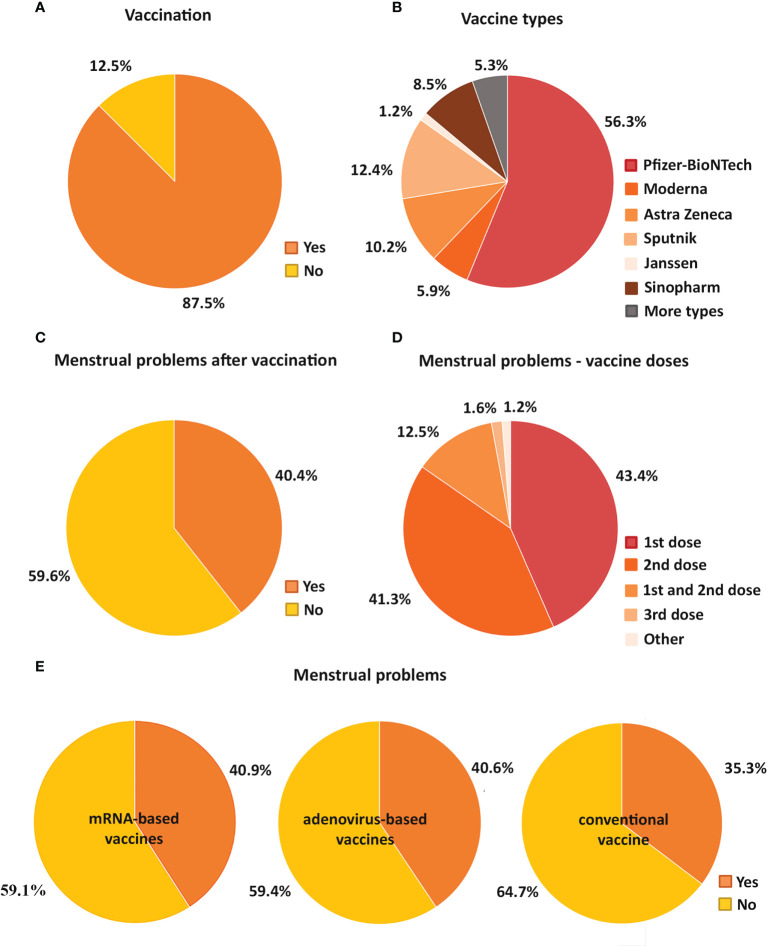
Pie charts demonstrate the percentage of vaccinated and unvaccinated individuals (A) and the proportion of the types of vaccines received in the vaccinated group (B). The percentage of participants with and without menstrual cycle problems after vaccination is also shown (C). It is also indicated how many doses of vaccine were given to those with menstrual cycle problems (D). In addition, pie charts show how the proportion of individuals with menstrual problems and without menstrual problems varied for mRNA-based (Pfizer-BioNTech, Moderna), adenovirus-based (AstraZeneca, Sputnik, Janssen) and conventional vaccines (Sinopharm) (E).

