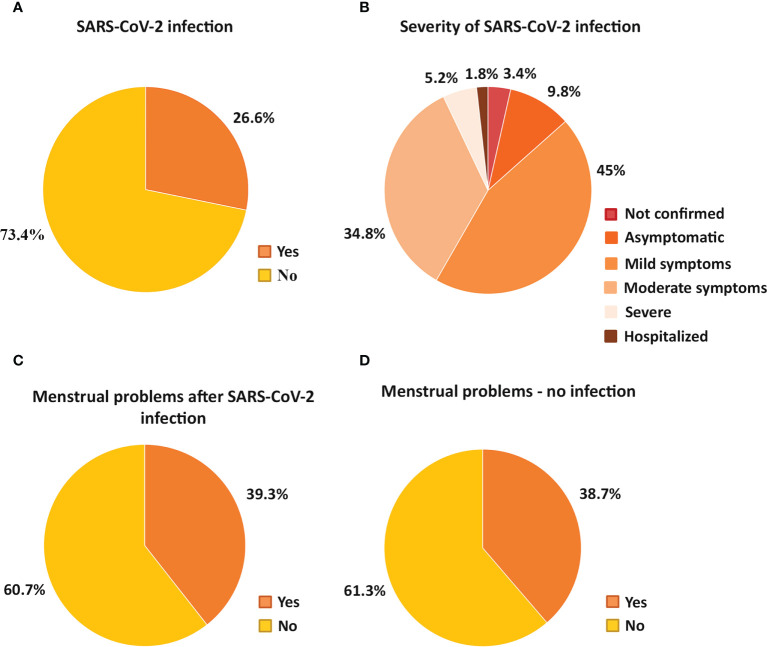
Figure 3.
Pie charts show the percentage of participants who were or were not infected with SARS-CoV-2 (A), detailing the proportion of infected individuals based on the severity of the infection (B). The percentage of participants with and without menstrual cycle problems after SARS-CoV-2 infection (C) or no infection (D) is also demonstrated.

