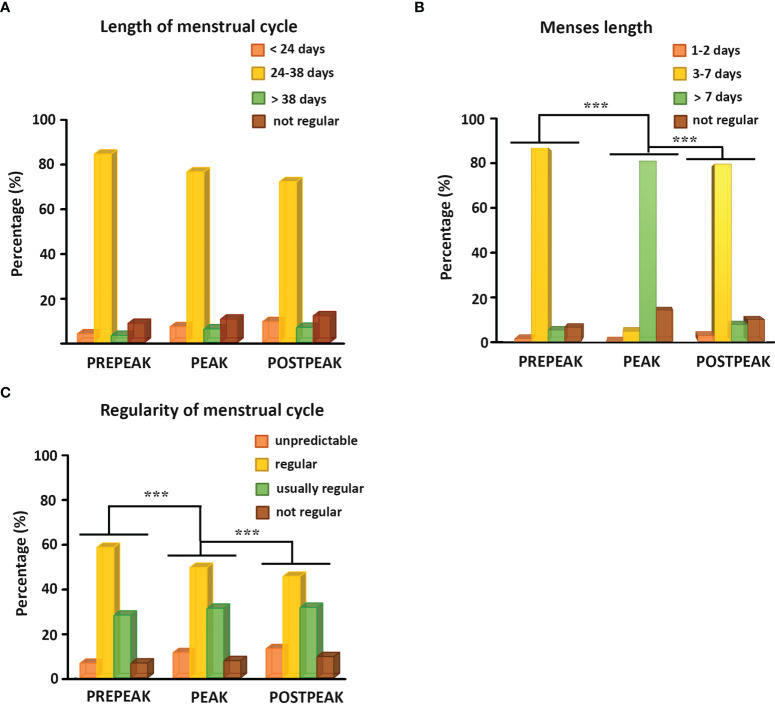
Figure 4.
(A) Histograms show the percentage of female individuals bleeding more frequently than 24 days, between 24 and 38 days, less frequently than 38 days and having no regular menstrual bleeding during the pre-peak, the peak, and the post-peak period. (B) Histograms illustrate the percentage of female participants with menses length lasting for 1-2 days, 3-7 days, more than 7 days or having no regular bleeding during the pre-peak, the peak, and the post-peak period. (C) Histograms demonstrate the percentage of female respondents with unpredictable cycle, having regular cycle with a maximum delay of 1-2 days, usually regular cycle with 1-2 missed cycles or 1-2 weeks difference a year, or not regular menstrual cycle during the pre-peak, the peak, and the post-peak period. ***p≤0.001.

