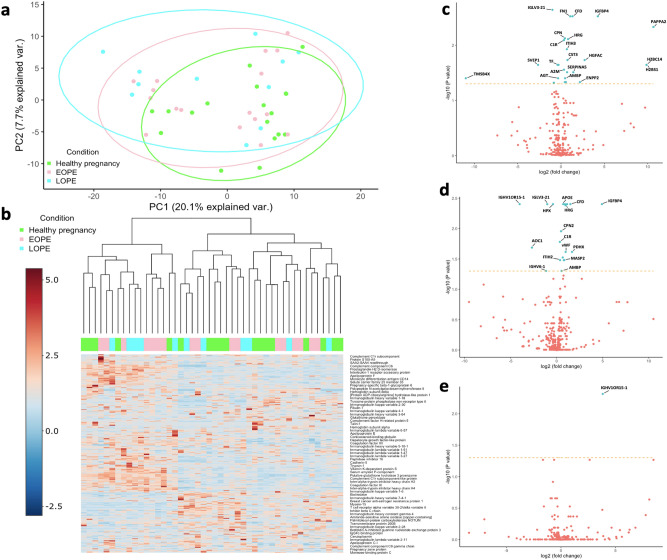
Figure 1.
Overviews of differential expression analysis. (a) Principal component analysis (PCA) plot of proteomic data in EOPE, LOPE and healthy pregnancy groups. (b) Multigroup heatmap with hierarchical clustering dendrogram of proteomic data levels across EOPE, LOPE and healthy pregnancy groups. Volcano plots of proteomic data in (c) EOPE versus healthy pregnancy, (d) LOPE versus healthy pregnancy, and e EOPE versus LOPE. The differential expression (DE) analysis was performed by fitting a linear regression model adjusted for GA at delivery. DE proteins were defined as Benjamini–Hochberg adjusted P value < 0.05, as indicated by the proteins above the cut-off lines.
Source data are provided as a Source Data file.

