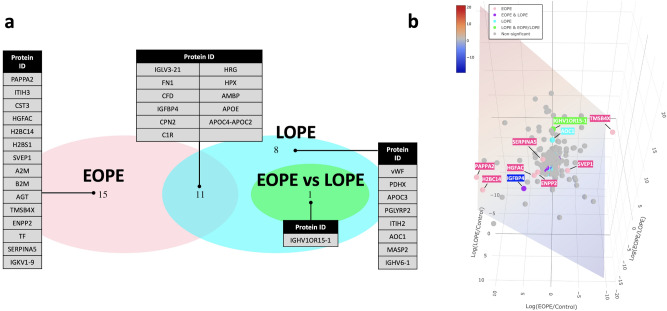
Figure 2.
Highlighted proteins in differential expression analysis. (a) Triple Venn diagram summarising the differentially expressed proteins unique and overlapped between EOPE versus healthy pregnancy, LOPE versus healthy pregnancy and EOPE versus LOPE. (b) Three-dimensional plot of fold changes (log2-transformed) of all identified proteins, with regression plane filled with colour indicator of log2-fold changes.
Source data are provided as a Source Data file.

