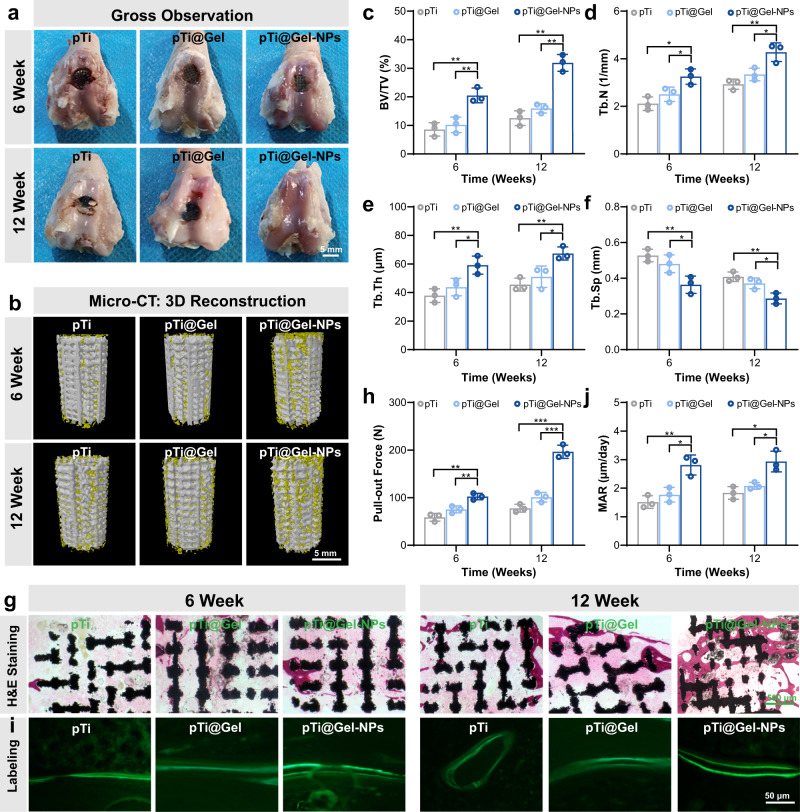
Fig. 7. Prosthetic interface osseointegration by hydrogel-mediated stem cell therapy.
a Gross appearance for the articular surface of distal femurs at weeks 6 and 12 after the treatment of pTi, pTi@Gel, and pTi@Gel-NPs scaffolds. b Representative 3D reconstruction images of bone regeneration from different scaffold treatments. c–f Quantitative statistics of BV/TV (c), Tb.N (d), Tb.Th (e), and Tb.Sp (f) from different groups according to Micro-CT scanning. g H&E staining of bone defects at weeks 6 and 12 after the treatment. h Quantitative analysis of the osseointegration according to biomechanical pull-out test. i Calcein fluorescence double-labeling staining of bone defects at weeks 6 and 12 after the treatment. j Quantitative analysis of mineral apposition rate via calcein fluorescence double-labeling. These data are presented as mean values ± SD (n = 3 independent experiments). Statistical significance was determined by two-tailed t test. *P < 0.05, **P < 0.01, and ***P < 0.001. Source data and exact P values are provided as a Source Data file.

