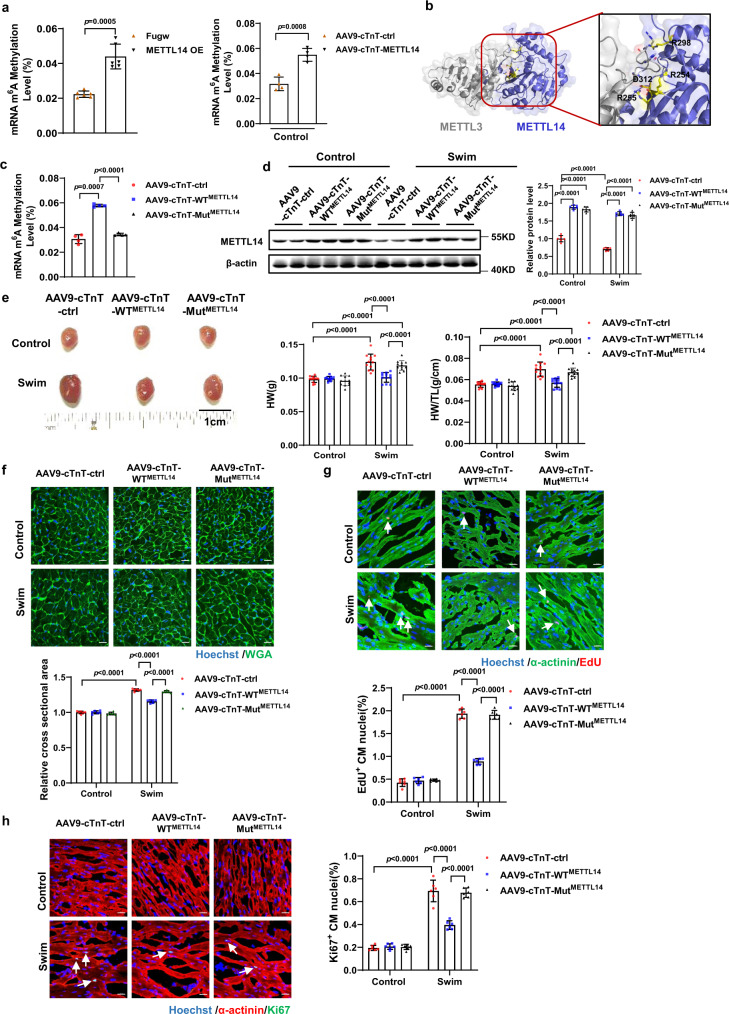
Fig. 4. MTase inactive mutant METTL14 blunts the anti-hypertrophic effects of METTL14 overexpression on exercise-induced cardiac hypertrophy.
a The relative mRNA m6A level infected with METTL14 overexpression in NRCM (n = 6/group) or mouse hearts (n = 4 /group). b Crystal structure of METTL3–METTL14 complex (PDB ID: 5IL0) showing the positively charged groove formed by METTL3-METTL14. Charged residues which are contributed by METTL14 are labeled as sticks. c The relative mRNA m6A level in hearts treated as indicated (n = 4/group). d Representative western blot and statistical data of METTL14 expression levels in mouse hearts treated as indicated (n = 6 mice/group). e Cardiac gross morphology, HW, and HW/TL in mouse hearts treated as indicated (n = 12 mice/group). f Representative images of WGA staining and quantification of the relative cell cross-sectional area in the mouse hearts treated as indicated (n = 6 mice/group). Scale bar: 20 μm. g Representative images of immunofluorescent staining and quantification of cardiomyocytes EdU positive ratio in the mouse hearts treated as indicated (n = 6 mice/group). Scale bar: 20 μm. h Representative images of immunofluorescent staining and quantification of the cardiomyocytes Ki67 positive ratio in the mouse hearts treated as indicated (n = 6 mice/group). Scale bar: 20 μm. NRCM, neonatal rat cardiomyocyte; Fugw, control without METTL14 overexpression; METTL14 OE, METTL14 overexpression; AAV9-cTnT-ctrl, cardiac-specific troponin-T promoter-driven control AAV9; AAV9-cTnT-METTL14, cardiac-specific troponin-T promoter-driven METTL14 overexpression AAV9; AAV9-cTnT-WTMETTL14, cardiac-specific troponin-T promoter-driven wild-type METTL14 overexpression AAV9; AAV9-cTnT- MutMETTL14, cardiac-specific troponin-T promoter-driven METTL14 R254/R255A-R298P-D312A mutant overexpression AAV9; HW, heart weight. HW/TL, heart weight/tibia length. WGA, Wheat Germ Agglutinin. EdU, 5-ethynyl-2’-deoxyuridine. All data are expressed as means ± SD. a Independent-sample t-test, two-sided; c one-way ANOVA followed by Dunnett T3 test; d–h two-way ANOVA followed by Tukey’s post hoc test. Source data are provided as a Source Data file.

