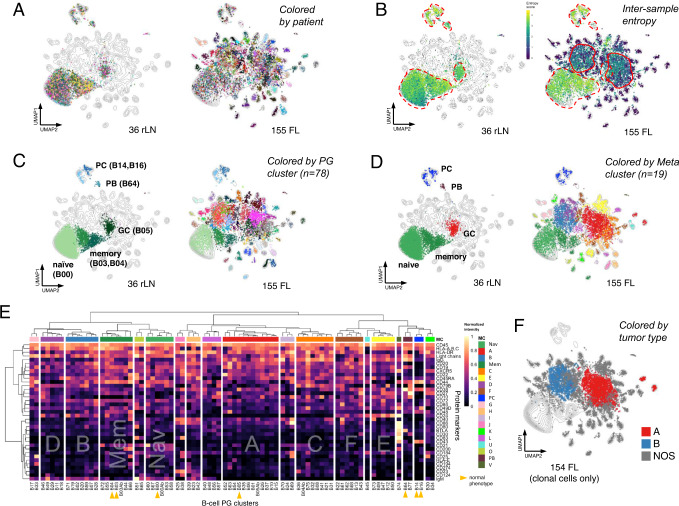
Fig. 1. Highly dimensional single-cell phenotyping reveals both variable and recurrent phenotypes in FL.
A Dimensional reduction UMAP plots of B-cell data from combined analysis of 36 rLN + 155 FL patient samples. Each dot represents a single cell. Dots are colored by patient sample. Equal numbers of cells from rLN and FL groups were randomly sampled for display. Contour lines show density in the combined dataset. B UMAP plots as in (A) but with cells colored by Shannon index to reveal mixing of cells from different patients (intertumoral entropy). Broken red lines highlight regions co-occupied by rLN cells. Solid red lines highlight two regions of high entropy unique to FL samples. C UMAP plots as in A but with cells colored according to their assigned PhenoGraph (PG) cluster. Normal B-cell populations in rLN samples were manually annotated based on expression of reference marker proteins. D UMAP plots as in A but with cells colored by their assigned MetaCluster (MC). E Heatmap of relative protein expression by CyTOF from all rLN and FL samples. Each row is a protein marker, each column is a B-cell PG cluster. B-cell clusters are hierarchically clustered into 19 MetaCluster (MC) groups. MC-Mem and MC-Nav include normal memory (B03, B04) and naïve (B00) B-cells; MC-A includes normal GC B-cells (B05). F UMAP plot as in A but with cells colored according to one of 3 defined tumor types. Individual samples with >50% clonal B-cells assigned to MC-A, MC-B, or neither were designated as types A, B, or NOS. FL follicular lymphoma, rLN reactive lymph node, GC germinal center, PB plasmablast, PC plasma cell, PG Phenograph, MC metacluster, NOS not otherwise specified, UMAP Uniform Manifold Approximation and Projection.

