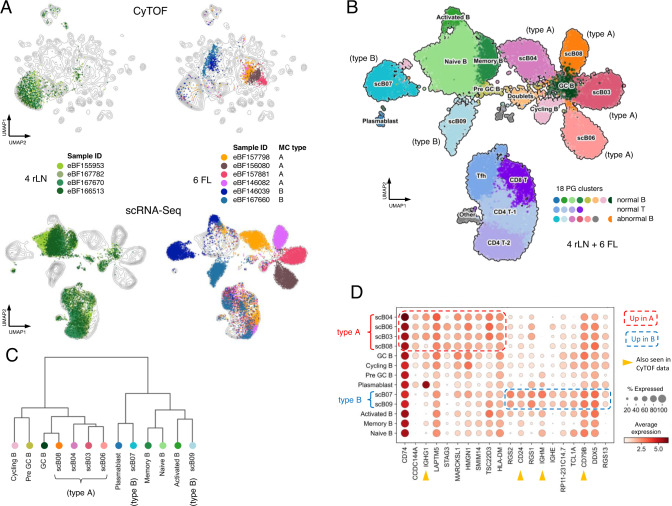
Fig. 2. Single-cell RNA-seq recapitulates CyTOF-defined FL subtypes.
A Parallel analysis by CyTOF and scRNA-seq. Upper panels show UMAP plots of CyTOF data as in Fig. 1A. Lower panels show UMAP plots of scRNA-seq data for the same set of samples. Each dot represents a single cell. Dots are colored by patient sample. Contour lines show density in the combined rLN + FL datasets. The indicated MC types were defined by CyTOF. B UMAP plot of scRNA-seq data as in lower panels of A but merging all 10 samples into the same plot. Dots are colored by their assignment into one of 18 scRNA-seq clusters. Normal B- and T-cell clusters were manually annotated based on expression of reference marker RNAs. scB clusters were unique to FL samples. Cells in the GC B cluster were assigned to the same cluster as scB08 but derive from rLN samples and are labeled separately for clarity. C Dendrogram of Pearson correlation distances between singlet B-cell scRNA-seq clusters using Ward’s method. Colors correspond to cell populations as indicated in B. D Mean expression levels of genes differentially expressed between abnormal B-cells from FL type A (scB03, scB04, scB06, scB08) vs type B (scB07, scB09) samples. Top 10 genes expressed in each of FL type A and B cells are depicted. Normal B-cell subsets are also included for reference. RNAs corresponding to proteins assessed in the CyTOF B-cell panel are indicated by yellow arrowheads. FL follicular lymphoma, rLN reactive lymph node, PG Phenograph, MC metacluster, GC germinal center, sc single cell, UMAP Uniform Manifold Approximation and Projection.

