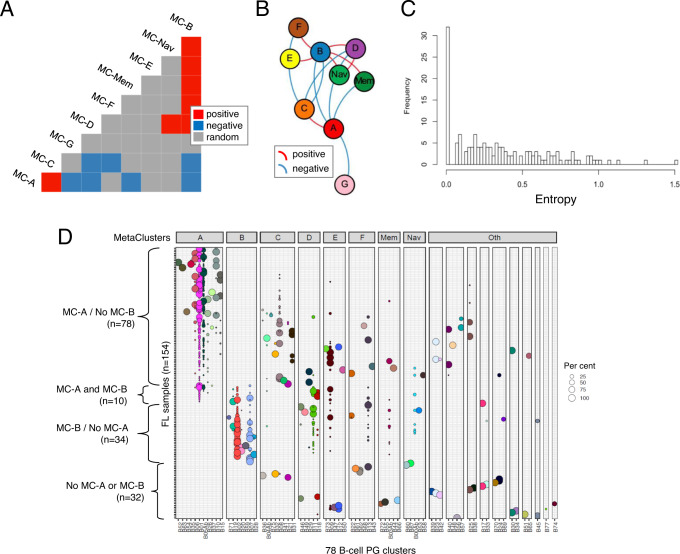
Fig. 3. B-cell cluster composition analysis reveals recurrent patterns within samples.
A, B Co-occurrence analysis for B-cell MC groups. Probabilistic model-based co-occurrence analysis was performed using malignant B-cells only from 154 FL samples without additional adjustment for multiple testing (see Methods section). A Co-occurrence matrix. Blue and yellow shaded boxes indicate statistically significant positive and negative co-occurrences, respectively (p < 0.05; probabilistic model-based co-occurrence test, 2-sided). B Co-occurrence network diagram. Force-directed graphing of co-occurrence associations. Each node represents a B-cell MC group. Edges indicate statistically significant positive or negative co-occurrence associations (p < 0.05; probabilistic model-based co-occurrence test, 2-sided). Lengths of edges and positioning of nodes are determined by a combination of attractive and repulsive forces which in sum are proportional to the strength of pairwise associations. C Intratumoral entropy score distribution among all FL samples (n = 154). Tumors with low entropy score contain cells mapping to a single PG, while tumors with high entropy scores contain cells mapping to up to 8 different PGs. D Composition of FL samples according to B-cell PG clusters. Bubbles within each row (= sample) indicate cells assigned to a given PG cluster (=column) with size proportional to their relative abundance in the sample (each row adding up to 100%). Bubbles are colored by PG cluster. PG clusters are grouped into metacluster (MC) groups. Samples are grouped by presence of MC-A and/or MC-B cells. FL follicular lymphoma, PG Phenograph, MC metacluster.

