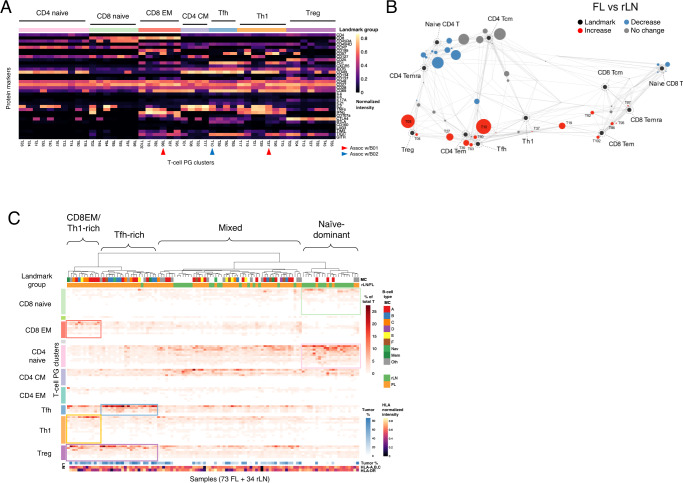
Fig. 4. FL samples exhibit a spectrum of T-cell states.
A Protein expression heatmap of T-cell PG clusters. Median expression values from CyTOF data are depicted for each cluster. Landmark group annotations were assigned manually by proximity in Scaffold map (B). The top 45 most populated PG clusters are depicted. T-cell clusters associated with B01/B02 B-cell clusters are highlighted (see Fig. 5a). B Scaffold map of T-cell populations in rLN and FL samples. Each node represents a T-cell PG cluster with size proportional to its median percentage across all samples. Landmark nodes are sizeless reference points defined by canonical markers. Edges are of length inversely proportional to phenotypic similarity. Nodes are colored according to statistically significant differences in abundance for the comparison FL vs. rLN (FDR < 0.05; 2-sided SAM test). C Sample composition by T-cell clusters. Heatmap indicates cell abundances in each sample (each column adding up to 100%). PG clusters are arranged by landmark groups. Samples are hierarchically clustered into T-cell signature groups using Ward’s method on Jensen-Shannon divergence. Tumor cell % and HLA expression tracks refer to clonal B-cells within each sample. FL follicular lymphoma, rLN reactive lymph node, PG phenograph, MC metacluster, EM effector memory, CM central memory, Tem T effector memory, Temra T effector memory re-expressing CD45RA, Tcm T central memory, Tfh T follicular helper, Th1 T helper type 1, Treg, T regulatory.

