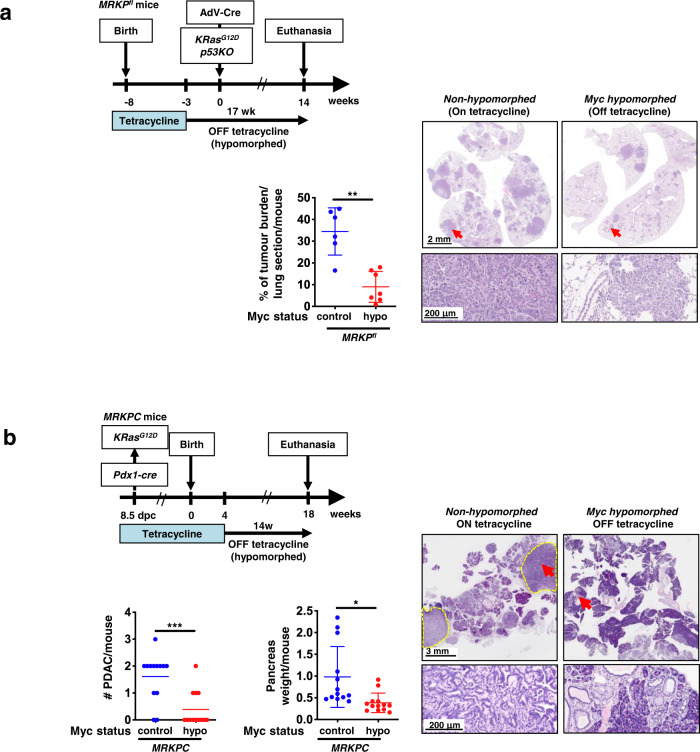
Fig. 2. Myc hypomorphism blocks lung and pancreatic tumour progression post KRasG12D activation but before the transition from indolent pre-tumour to invasive neoplasia.
a Left: schematic of study. MRKPfl (MycTRE/TRE;β-actin-tTSKid/–;LSL-KRasG12D/+;p53flox/flox) mice were maintained on tetracycline (endogenous Myc at wt levels) throughout embryonic and post-natal development until 5 weeks of age. Tetracycline was then withdrawn to hypomorph Myc and 3 weeks later KRasG12D activated and p53 concurrently inactivated sporadically in lung epithelium by Adv-Cre inhalation. Mice were euthanized 14 weeks post Adv-Cre inhalation and lung tissues harvested. Control animals were treated identically save that they were maintained throughout on tetracycline to sustain wt endogenous Myc levels. Centre: quantitation of overall tumour load in non-Myc hypomorphed (blue) versus hypomorphed (red) MRKPfl mice 14 weeks post Adv-Cre inhalation. Results depict mean ± SD in each treatment group. The unpaired t-test with Welch’s correction and two-tailed analysis was used to analyse tumour load. **p < 0.01. n = 6 for non-Myc hypomorphed and n = 7 for hypomorphed mice with p = 0.0010. Right: representative H&E staining of lung tissue harvested from non-hypomorphed versus hypomorphed MRKPfl mice 14 weeks post Adv-Cre inhalation. Arrows mark regions shown at higher magnification below. b Upper left: Schematic of study. In MRKPC (MycTRE/TRE;β-actin-tTSKid/–;LSL-KRasG12D/+;LSL-p53R172H/+;Pdx-1-Cre) mice expression of Cre recombinase is driven from the pdx/IPF1 promoter, triggering co-expression of KRasG12D and p53R172H in pancreatic progenitor cells from around 8.5 dpc. wt levels of endogenous Myc were maintained throughout development and into adulthood by continuous administration of tetracycline. At 4 weeks of age, tetracycline was withdrawn from mice to hypomorph endogenous Myc and animals euthanized 14 weeks later (total 18 weeks old). Tetracycline administration was maintained throughout in the control, non-hypomorphed cohort. Bottom left: quantitation of PDAC tumours per mouse in non-hypomorphed (blue) versus hypomorphed (red) MRKPC mice and overall pancreas weight (a surrogate for tumour load) in the same animals. The unpaired t-test with Welch’s correction and two-tailed analysis was used to analyse the data. Mean ± SD are shown. *p < 0.05, ***p < 0.001. FOV = field of view. SD = standard deviation. For quantitation of PDAC tumours and overall pancreas weight, n = 13 for both non-Myc hypomorphed control and hypomorphed mice with p = 0.0005 and p = 0.0110, respectively. Right: representative macroscopic, low- and high-power images of non-hypomorphed versus hypomorphed pancreata at 18 weeks, showing multiple PDAC tumours in the former but none in the latter. Dotted yellow lines represent the margins of a representative PDAC tumour. Arrows mark regions shown at higher magnification below. Source data are provided as a Source Data file.

