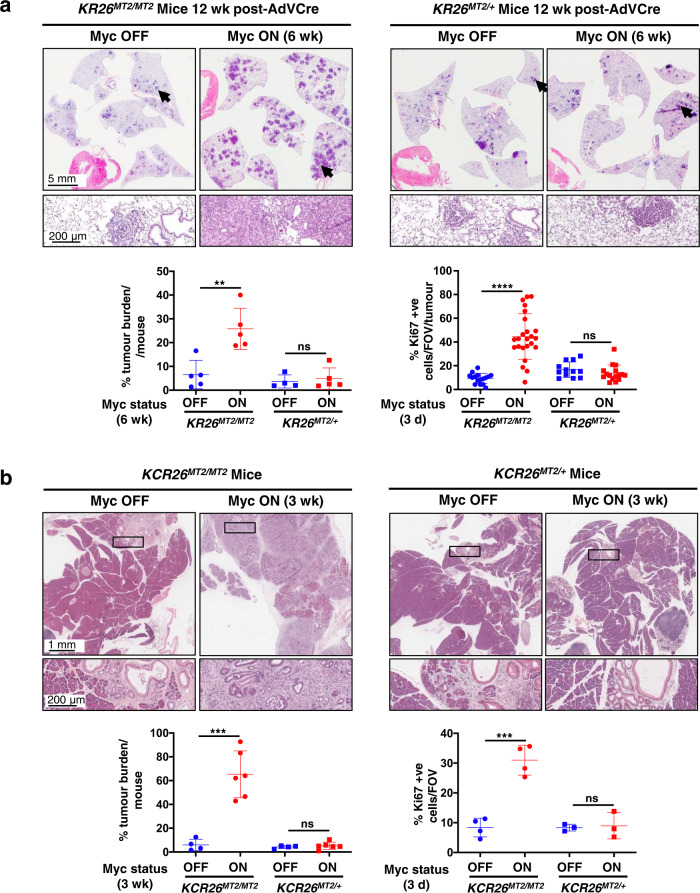
Fig. 3. Deregulated Myc must be expressed above a tight threshold level to drive transition from indolent pre-tumour to lung and pancreas adenocarcinoma in vivo.
a Co-expression of KRasG12D and MycERT2 was sporadically triggered in lung epithelium of either KR26MT2/MT2 (LSL-KRasG12D/+;R26MT2/MT2 – 2 copies of Rosa26-MycERT2) or KR26MT2/+ (LSL-KRasG12D/+;R26MT2/+ 1 copy of Rosa26-MycERT2) adult mice by Adenovirus-Cre inhalation. 6 weeks later (i.e. after 6 weeks of KRasG12D-only activity) MycERT2 was also activated for a further 6 weeks (Myc ON). MycERT2 was not activated in control mice (Myc OFF). Representative H&E-stained sections of lungs from KR26MT2/MT2 versus KR26MT2/+ mice are shown without (left) and with (right) Myc activation. H&E panel inserts below show arrowed regions at higher magnification. Lower panel left: quantitation of percentage tumour burden relative to the total lung in KR26MT2/MT2 and KR26MT2/+ mice, either without or with Myc for 6 weeks. Results depict mean ± SD. Data were analysed using unpaired t-test with Welch’s correction and two-tailed analysis. For KR26MT2/MT2 mice, n = 5 for both Myc OFF and Myc ON groups with p = 0.0045; for KR26MT2/+ mice, n = 4 for Myc OFF and n = 5 for Myc ON groups with p = 0.6346. Lower panel right: quantitation of proliferation (immunohistochemical staining for Ki67) of independent tumours in sections of lungs harvested from KR26MT2/MT2 and KR26MT2/+ mice 12 weeks after activation of KRasG12D either without or with activation of MycERT2 for 3 days. Results depict mean ± SD. For KR26MT2/MT2 mice, n = 16 independent tumours (4 mice) for Myc OFF and n = 24 independent tumours (6 mice) for Myc ON groups with p < 0.0001; for KR26MT2/+ mice, n = 12 independent tumours (3 mice) for Myc OFF and n = 16 independent tumours (4 mice) for Myc ON groups with p = 0.2553. b. Representative H&E-stained sections of pancreata from 15 week-old KCR26MT2/MT2 (LSL-KRasG12D/+;pdx1-Cre;R26MT2/MT2) and KCR26MT2/+ (LSL-KRasG12D/+;pdx1-Cre;R26MT2/+) mice either without or with Myc activation for 3 weeks. H&E panel inserts below show boxed regions at higher magnification. Lower panel left: quantitation of percentage tumour burden relative to the total pancreas from KCR26MT2/MT2 and KCR26MT2/+ mice, either without or with Myc activation for 3 weeks. Results depict mean ± SD. Data were analysed using unpaired t-test with Welch’s correction and two-tailed analysis. For KR26MT2/MT2 mice, n = 4 for Myc OFF and n = 6 for Myc ON groups with p = 0.0004; for KR26MT2/+ mice, n = 4 for Myc OFF and n = 6 for Myc ON groups with p = 0.4809. Lower panel right: quantitation of proliferation (Ki67) in sections of pancreata harvested from 12 week-old KCR26MT2/MT2 and KCR26MT2/+ mice, either without or with activation of MycERT2 for 3 days. Results depict mean ± SD; each data point represents the average quantification of % ki67 staining of lesions from four different regions of the pancreas. Data were analysed using unpaired t-test with Welch’s correction and two-tailed analysis. For KR26MT2/MT2 mice, n = 4 for both Myc OFF and Myc ON groups with p = 0.0006; for KR26MT2/+ mice, n = 3 for both Myc OFF and Myc ON groups with p = 0.8248. **p < 0.01, ***p < 0.001, ****p < 0.0001, ns= non-significant. SD = standard deviation. Part of Fig. 3 (some data relating to KR26MT2/MT2 and KCR26MT2/MT2 mice) is included for reference and is from previous publications37,38. Source data are provided as a Source Data file.

