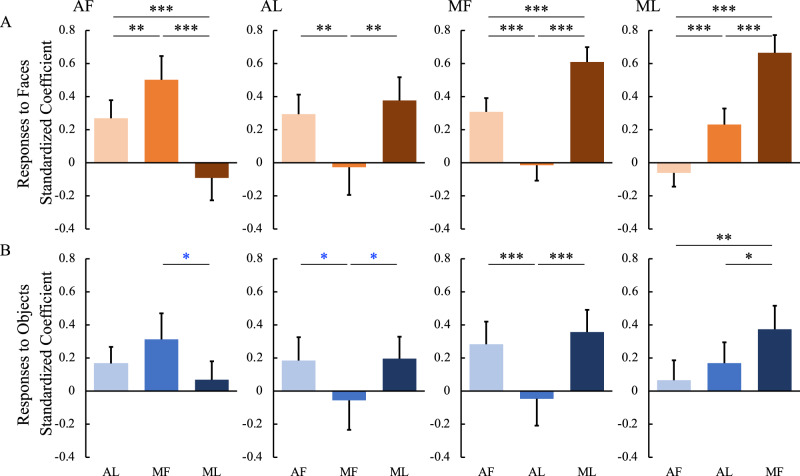
Fig. 8. Functional relationships among the temporal face patches.
Standardized beta-coefficients for linear regression with responses to faces (A) and objects (B) in one face patch (the name is shown at the top left of each panel) as outcome and responses to faces/objects in the rest of the face patches as predictors (the name is shown as the horizontal axis labels at the bottom of each column). P values were calculated with bootstrap tests (n = 10,000) adjusted for multiple testing using the Holm-Bonferroni method. Black *p < 0.05, **p < 0.01, ***p < 0.001. Blue *p < 0.05 uncorrected. Box plots display mean values ± 95% CI. MF middle fundal face patch, ML middle lateral face patch, AF anterior fundal face patch, AL anterior lateral face patch.

