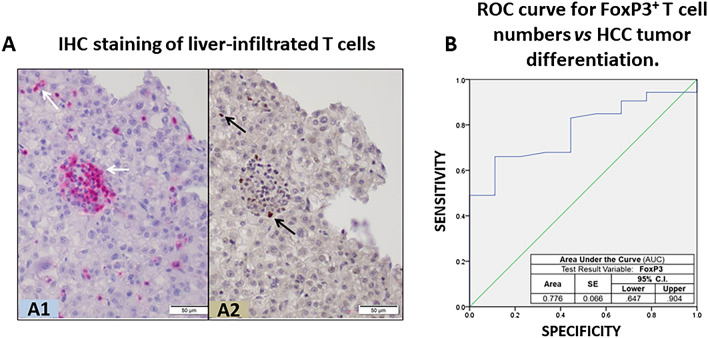
Figure 1.
Infiltration of T cells in HCC samples from transplanted liver patients. (A) Conventional IHC staining of liver-infiltrated T cells in a representative section of paraffin-embedded HCC-bearing liver reveals: (A1) presence of T cell-like CD3+ cells (purple dots showing clusters of CD3+ cells) in the liver sinusoids and parenchyma, and (A2) FoxP3+ cells (brown dots); scale bar 50 µm. (B) Receiver operating characteristic (ROC) curve comparing sensitivity and specificity for the risk index of poor HCC differentiation across a range of FoxP3+ infiltrate values.

