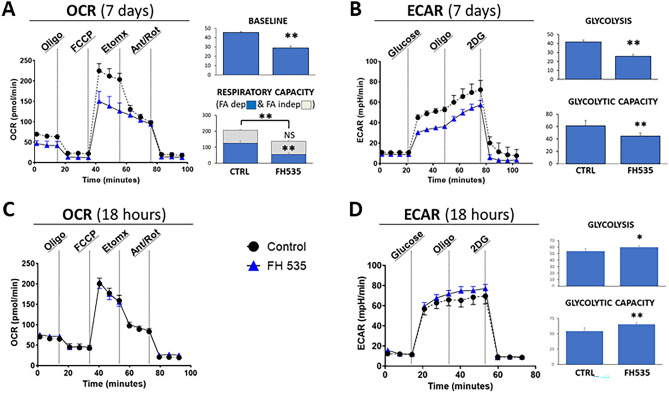
Figure 3.
Bioenergetic deterioration of Treg cells after exposure to FH535. (A) Oxygen consumption rate (OCR) profiles of Treg cells after 7-day culture in the absence (Control) or presence of FH535. Bar panels show the corresponding measurements of Baseline and Respiratory Capacity, differentiated between FA-dependent (Etomoxir-sensitive, blue bars) and FA-independent (Etomoxir-resistant, grey bars) respiration. (B) Extracellular acidification rate (ECAR) profiles of Treg cells under the same conditions as in (A). AUC measurements of corresponding ECAR values of Glycolysis and Glycolytic capacity. (C,D) OCR and ECAR readings of Treg cells cultured in FH535 or vehicle control for 18 h (C) Exposure to FH535 did not induce any change on the OCR profile. (D) In contrast, exposure to FH535 enhanced glycolysis and glycolytic capacity of Treg cells. Results show the mean ± SD from six replicates. (*)p < 0.05 and (**)p < 0.005 significance were determined by Student’s t test.

