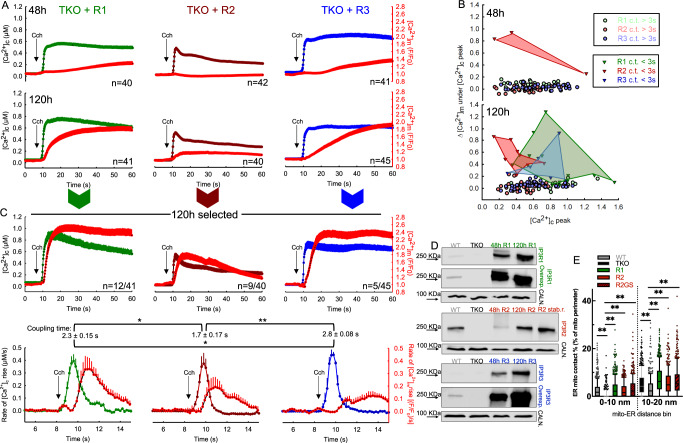
Fig. 2. IP3R overexpression in TKO cells enhanced ER-mitochondrial Ca2+ signaling and restored close ERMCs.
A Mean time courses of the Cch-induced [Ca2+]c responses in R1 (green), R2 (maroon), and R3 (blue) acute 48 h (upper panel) and 120 h (lower panel) rescue in TKO HEK cells. Corresponding changes in the [Ca2+]m are shown as red traces on each graph. B [Ca2+]m at the time of [Ca2+]c peak plotted as a function of the [Ca2+]c peak in 48 h (upper panel) and 120 h (lower panel) rescue. The shaded area highlights the cells showing tight ERMC Ca2+ coupling. C Average [Ca2+]c responses of a selected subpopulation of cells with less than 3 s cyto-mito coupling time after 120 h of expression of IP3R1 (green), R2 (maroon) and R3 (blue) and the corresponding changes in [Ca2+]m (red) (upper panel). Mean traces of the cytosolic and corresponding mitochondrial rates of Ca2+ rise in the selected 120 h acute rescue TKO cells, and the calculated average coupling time for each condition (±SEM, One-way ANOVA, normality test (Shapiro–Wilk), all pairwise multiple comparison procedures (Holm–Sidak method)). D Immunoblot showing the IP3R expression in WT HEK, TKO HEK, and IP3R acute rescue TKO cells for 48 and 120 h and TKO HEK cells stably rescued with R2. E Box plots showing the percentage of close, 0–10 and 10–20 nm contacts in WT (gray; n = 455 mitochondria/3 independent fixation), TKO (black; n = 377/3) and TKO HEK stably expressing R1 (green; n = 464/3), R2 (maroon; n = 383/3) and pore mutant R2GS3 (shaded maroon; n = 411/3) (**p < 0.001; Unpaired t-test; Two-tailed p value, box plots indicate median, 25th and 75th percentile (box), and 10th and 90th percentile (whiskers) as well as outliers (dots)). Source data are provided for each panel as a Source Data file.

