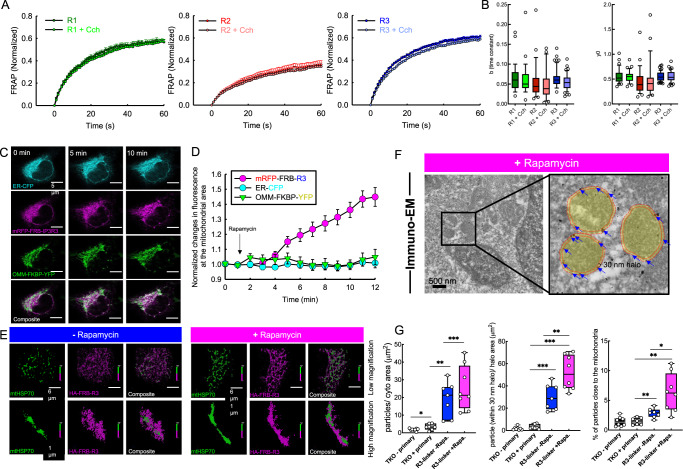
Fig. 3. Lateral mobility of IP3Rs allows their trapping at ERMCs.
A Average time courses showing IP3R-mRFP fluorescence recovery after photobleaching normalized to the pre-bleach intensity in unstimulated R1 (green), R2 (maroon), and R3 (blue) and Cch stimulated R1 (light green), R2 (light red) and R3 (light blue) acute TKO rescue cells (datapoints represent averages with ±SEM, (R1 n = 32, R1 + Cch n = 37, R2 n = 37, R2 + Cch n = 23, R3 n = 55, R3 + Cch n = 43 from three experiments). B Calculated time constant and recovery (y0) for each IP3R isoform with and without agonist stimulation (R1 n = 32, R1 + Cch n = 37, R2 n = 25, R2 + Cch n = 23, R3 n = 55, R3 + Cch n = 43 from three experiments; Unpaired t-test; Two-tailed p value; b: R1 vs R1 + Cch p = 0.4819, R2 vs R2 + Cch p = 0.4494, R3 vs R3 + Cch p = 0.0585; y0: R1 vs R1 + Cch p = 0.7404, R2 vs R2 + Cch p = 0.7596, R3 vs R3 + Cch p = 0.9114, Box plots indicate median, 25th and 75th percentile (box), and 5th and 95th percentile (whiskers) and outliers (single points). C Representative images showing the R3-mRFP (magenta), ER-CFP (cyan), and OMM-YFP (YFP) signals before and after (5 and 10 min) the addition of rapamycin. D R3-mRFP-FRB (magenta circles) and ER-CFP (cyan circles) co-localization over time with FKBP-YFP-OMM (green triangles), presented by changes in mRFP and CFP fluorescence under the YFP mask over time. (n = 10 cells from three experiments; datapoints represent averages with ±SEM). E STORM super-resolution images showing the R3-OMM positioning without (before) and with (after) rapamycin treatment. F Representative Immuno-EM image of a rapamycin-treated, R3-linker-expressing cell and a magnified field with highlighted mitochondria (yellow). The 30 nm halo area is between the solid and dashed red lines. Individual gold particles within the halo area are marked with blue arrows. G Quantification of the ImmunoGold labeling in non-transfected no primary (black; n = 8), non-transfected plus primary (dark gray; n = 7), IP3R3-linker without rapamycin (blue; n = 7) and R3-linker with rapamycin treatment (magenta; n = 8) (Images were processed from from three independent fixation, Statistical probe: Unpaired t-test; Two-tailed p values, particles/cyto area: TKO - primary vs TKO + primary p = 0.0396, R3-linker -Rapa. vs +Rapa. p = 0.369, TKO + primary vs R3-linker -Rapa p = 0.0012, TKO + primary vs R3-linker +Rapa p = 0.0005; particles within 30 nm halo/halo area: TKO - primary vs TKO + primary p = 0.1384, R3-linker -Rapa. vs +Rapa. p = 0.0091, TKO + primary vs R3-linker -Rapa <0.0001, TKO + primary vs R3-linker +Rapa <0.0001; % of particles close to the mitochondria: TKO - primary vs TKO + primary p = 0.9062, R3-linker -Rapa. vs +Rapa. p = 0.0166, TKO + primary vs R3-linker -Rapa p = 0.0031, TKO + primary vs R3-linker +Rapa p = 0.0019* p < 0.05, ** p < 0.01, ***<0.0001 box plots indicate median, 25th and 75th percentile (box), and 10th and 90th percentile (whiskers) and all datapoints)). Source data are provided for panels A, B, D, G as a Source Data file.

