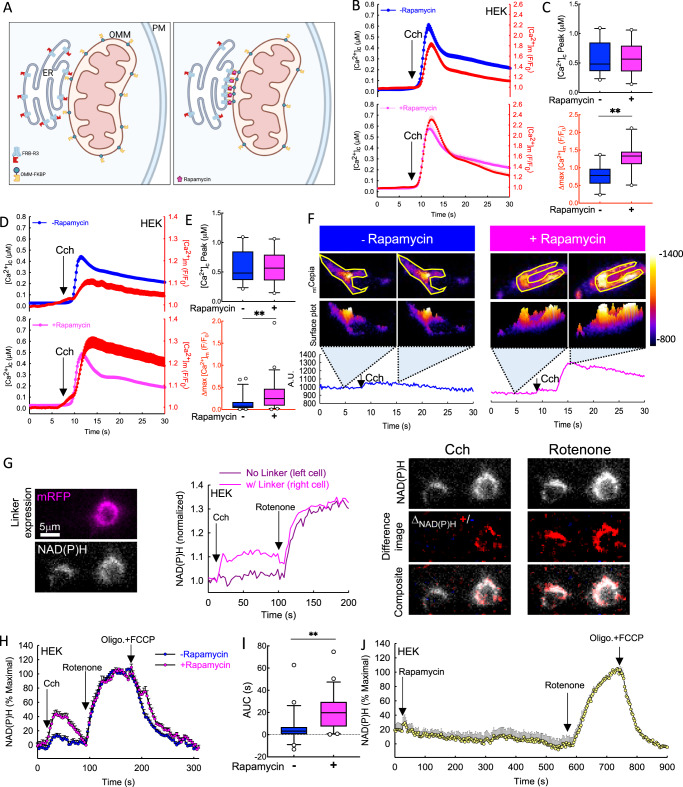
Fig. 4. Effective ER-mitochondrial Ca2+ communication is dependent on IP3R3 localization to the ERMCs.
A Scheme depicting R3-FRB and FKBP-OMM linkage by rapamycin. (Created in BioRender). B Average time courses showing the carbachol-induced changes in the [Ca2+]c and the corresponding changes in [Ca2+]IMS (red traces), without (blue) and with (pink) rapamycin treatment in R3-FRB and FKBP-OMM expressing TKO HEK cells in 0 mM Ca2+ ECM. C Box plots showing the maximal change in [Ca2+]c (upper) and [Ca2+]IMS (lower) for both conditions (−Rapa n = 22, +Rapa n = 18), Unpaired t-test; Two-tailed p value; [Ca2+]c peak p = 0.9818, Δmax[Ca2+]m **p < 0.001). D Mean [Ca2+]c and corresponding [Ca2+]m (red traces) responses to agonist stimulation under the same conditions as described in (E). Maximum [Ca2+]c (upper) and [Ca2+]m (lower) responses to agonist (**p < 0.001, Kruskal–Wallis One-way ANOVA on Ranks, all pairwise multiple comparison procedures (Dunn’s Method); −Rapa n = 47, +Rapa n = 52). F Pseudo-colored representative images showing changes in mtCepia intensity without (blue) and with (magenta) rapamycin treatment before and after agonist stimulation in R3-linker-expressing TKO HEK cells. Representative traces were obtained from the ROIs (yellow) shown in the upper images. G Representative mRFP and NAD(P)H images of a non-transfected and a linker-expressing cell (left). Traces from the same cells showing Cch and rotenone-induced changes in NAD(P)H fluorescence (middle) and different images showing the localization of NAD(P)H changes (right). H Agonist induced changes in the NAD(P)H autofluorescence with and without R3 linkage to the OMM (−Rapa n = 49, +Rapa n = 46). I Calculated the AUC of the Cch-induced NAD(P)H response. J Average traces showing the effect of 100 nM rapamycin treatment on the NAD(P)H level (n = 27). (*p < 0.05, **p < 0.001, Kruskal–Wallis One-way ANOVA on ranks, all pairwise multiple comparison procedures (Dunn’s Method)). All box plots indicate median, 25th and 75th percentile (box) and 5th and 95th percentile (whiskers), and outliers (single points). Source data are provided for panels B–E, G–J as a Source Data file.

