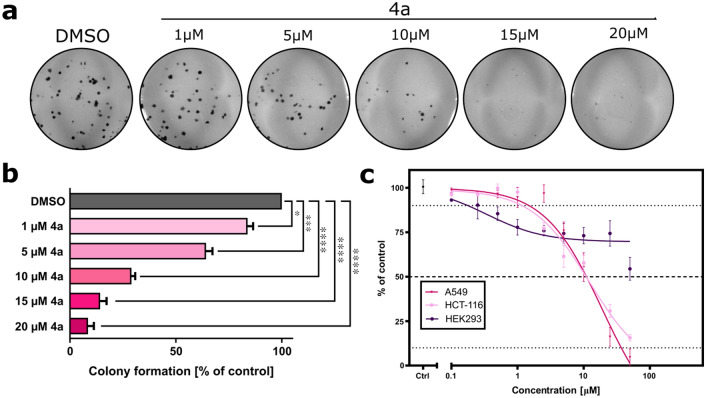
Figure 3.
Effect of 4a on colony formation and cell viability. (a) Representative photos of the colony formation assay after the treatment of A549 cells with increasing concentrations of 4a. (b) Quantification of the colony formation assay. (c) Effect of 4a on cell viability after incubation with compound for 72 h. Data represent the mean ± SEM of n = 3 independent experiments. *p < 0.01, **p < 0.001, ***p < 0.0001, and ****p < 0.00001.

