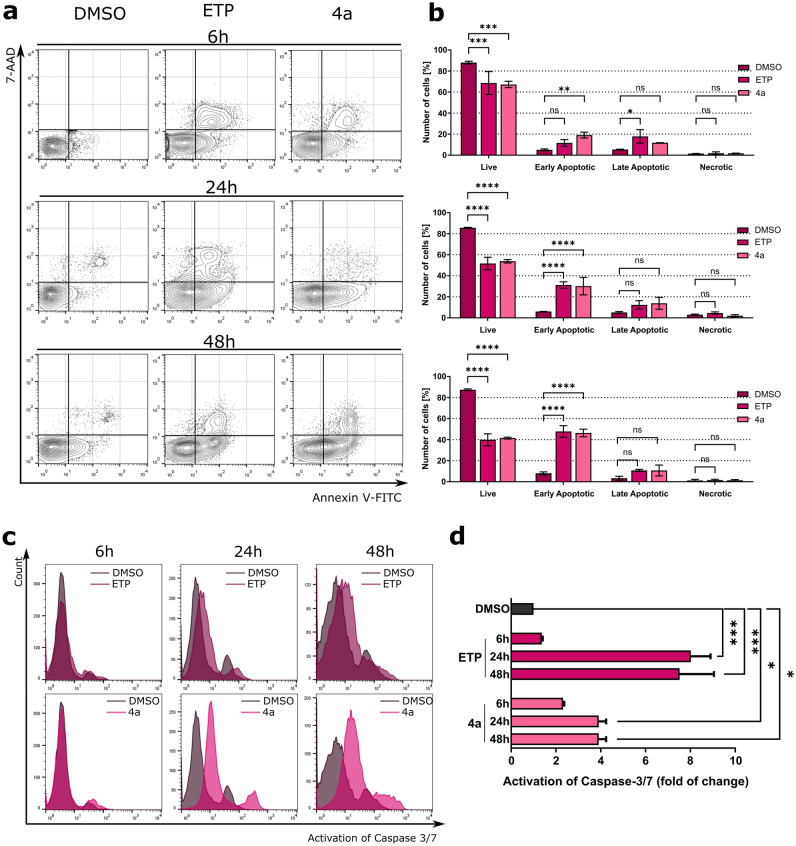
Figure 5.
Detection of apoptosis by flow cytometry. (a) Representative dot plots after treatment of A549 cells with 4a. (b) Quantitation of A549 cells after Annexin V-FITC/7-AAD staining. (c) Detection of caspase-3/7 activation in 4a-treated A549 cells, presented as representative histograms. (d) Quantification of analysis from (c). Data represent the mean ± SEM of n = 3 independent experiments. *p < 0.01, **p < 0.001, ***p < 0.0001, and ****p < 0.00001.

