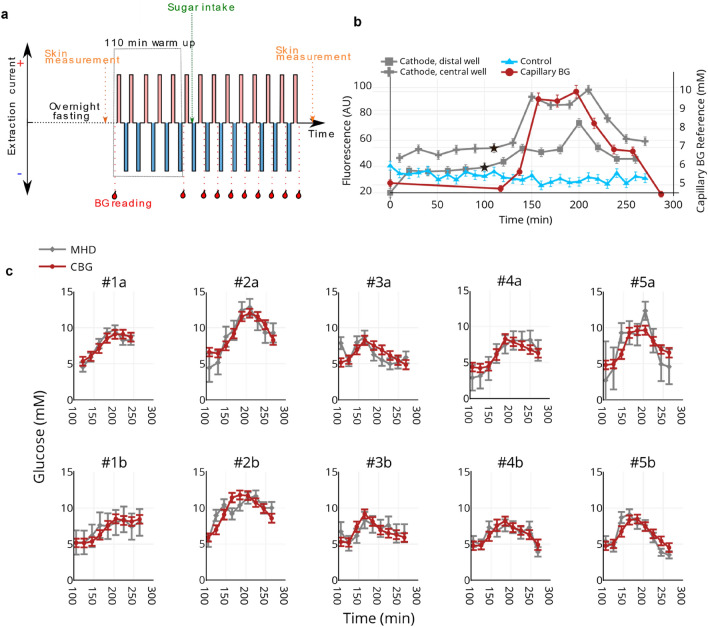
Figure 2.
Glucose tolerance tests. ( a) Schematic presentation of the glucose tolerance test timeline (black dashed line). Volunteers entered the test after overnight fasting (9 h). 5 min MHD extractions were conducted with alternating current polarity. The red and blue bars indicate the direction of the applied electric current for each extraction. Capillary blood glucose measurements, represented by red blood drops and red dashed lines, were taken twice before sugar intake (green dashed line). 8 more capillary blood glucose readings were obtained after the glucose drink with 20 min intervals. The skin hydration and transepidermal water loss readings were recorded before and after the test. (b) Raw data from a representative experiment. These data are from the MHD cathode central well (grey diamonds), the control well (blue triangles), and reference blood glucose measurements (red circles). The first data point after warm-up is shown as a star. Error bars for the MHD and diffusion raw data are based on the standard error of the diffusion data recorded after the warm-up period. Error bars for the CBG concentrations are based on the standard error of our reference device. (c) All 10 experiments shown after linear interpolation of the reference CBG and after applying calibration. Each column consists of two experiments involving a single participant. Error estimates for the interstitial fluid glucose (ISFG) (not shown) are based on a combination of the standard error of the control well measurements and the standard error of our reference device and are in almost all cases ± 1–2 mM.

