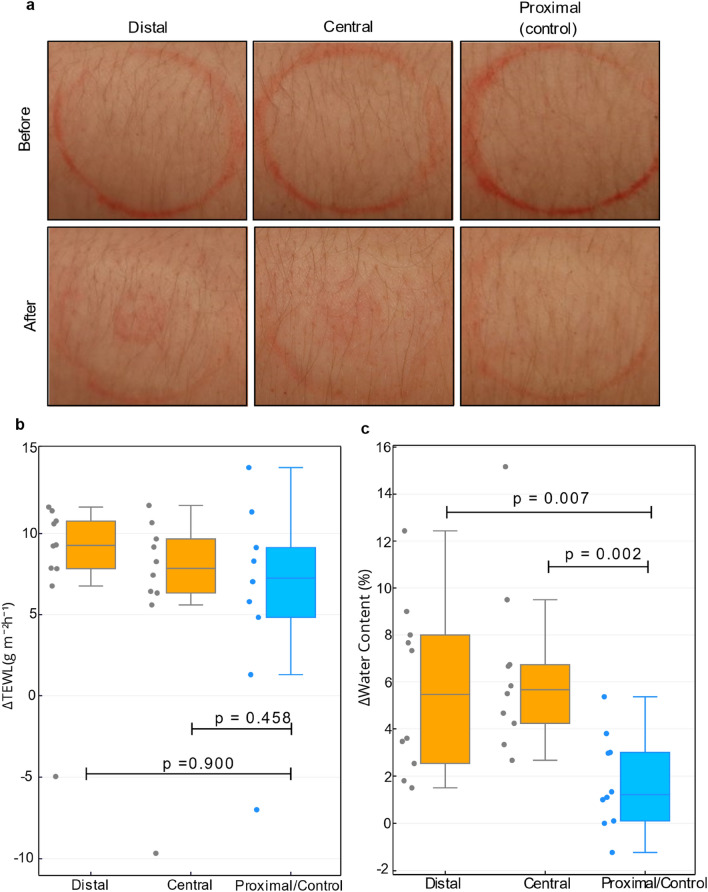
Figure 4.
Effect of extraction on the skin. (a) Photographs of the skin MHD well sites before and after the glucose tolerance test that includes 30 extractions lasting 5 min. The extraction well outline was marked with a red makeup pen before the experiment. (b) ΔTEWL and (c) Δ skin water content for each well from all 10 experiments. Δ values were obtained by measuring the skin parameters before and after the experiment and by calculating the difference between these values (Δ = after – before). p values were obtained via t-test, with p ≤ 0.05 considered significant.

