Figure 1.
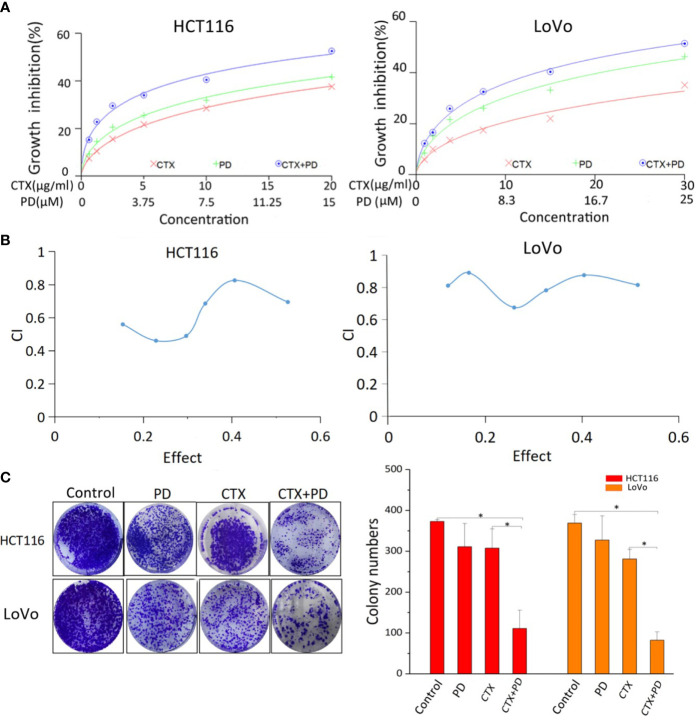
Results of CCK-8 and colony formation assays of PD- and CTX-treated cells. (A) The inhibitory effects of PD and/or CTX treatment in HCT116 and LoVo cells were examined by CCK-8 assay after treatment for 48 h. (B) The results of CCK-8 assay were analyzed with the CalcuSyn software. Combination Index (CI) was calculated by the Calcusyn software. CI < 1 was considered synergistic, CI = 1 additive, and CI > 1 antagonistic cytotoxicity. (C) The colony-formation assay was performed, and the results are displayed as colony numbers. Columns showed mean ± S.D. ‘Control’ was compared with the other groups, ‘CTX’ was compared with ‘CTX+PD’ using one-way ANOVA. *P < 0.05 represents a significant difference.

