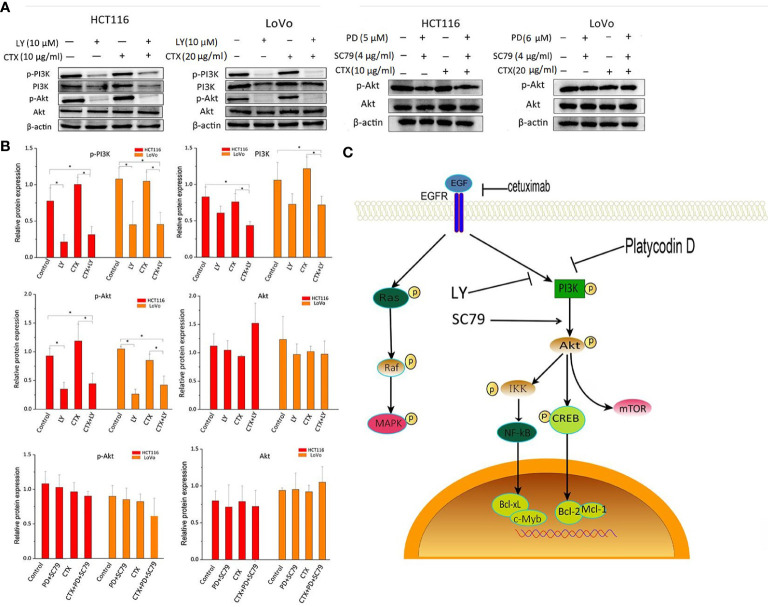
Figure 3.
Western blot analysis of PI3K and Akt in cells treated with LY294002 and SC-79. (A) Western blot images. The left column shows protein names, including p-PI3K, PI3K, p-Akt, Akt, and β-actin, which was used as loading control. The top row shows two cell lines HCT116 and LoVo, and drug treatment with different combinations. ‘LY’ represents LY294002. (B) Bar plots of densitometric analysis. Protein expression levels are normalized to that of the loading control. Columns show the mean ± S.D. One-way ANOVA was used to analyze P values between groups. All groups are compared with the ‘Control’ group, the ‘CTX’ group is compared with the ‘CTX+LY’ or ‘CTX+PD+SC79’ group. *P < 0.05 represents a significant difference. (C) The signaling pathway by which PD enhances the cytotoxicity of CTX. A PI3K inhibitor and an Akt activator were used to confirm the inhibitory effect of PD on PI3K.

