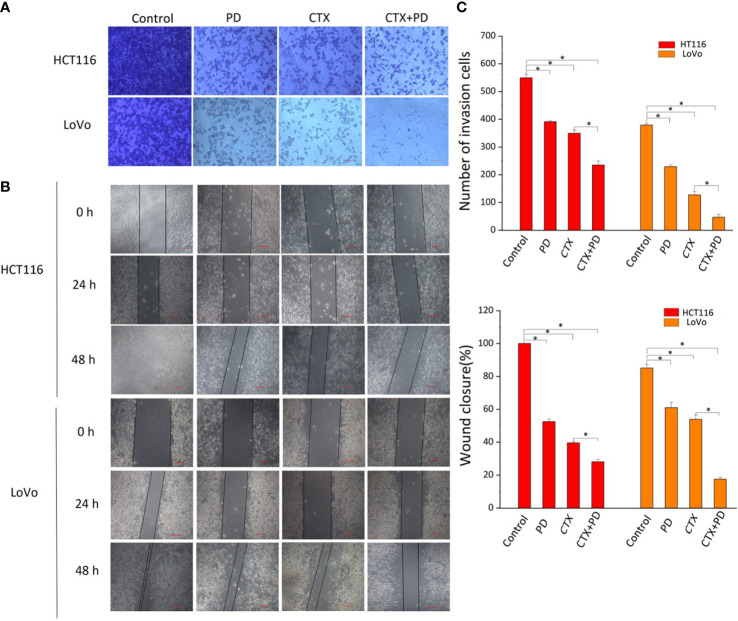
Figure 5.
Results of Transwell and scratch wound-healing assays. (A) Invasion of HCT116 and LoVo cells were both measured by Transwell assay. The top row shows various drug treatments. Scale bars, 100 μm. (B) Migration of HCT116 and LoVo cells were both measured by scratch wound-healing assay. The top row shows various drug treatments. The left column shows the type of cells and time of measurement. (C) Bar diagrams of Transwell (C1) and scratch wound-healing (C2) assays. Columns show the mean ± S.D. One-way ANOVA was conducted to analyze P values between groups. All groups are compared with the ‘Control’ group, and the ‘CTX’ group is compared with the ‘CTX+PD’ group. *P < 0.05 represents a significant difference.

