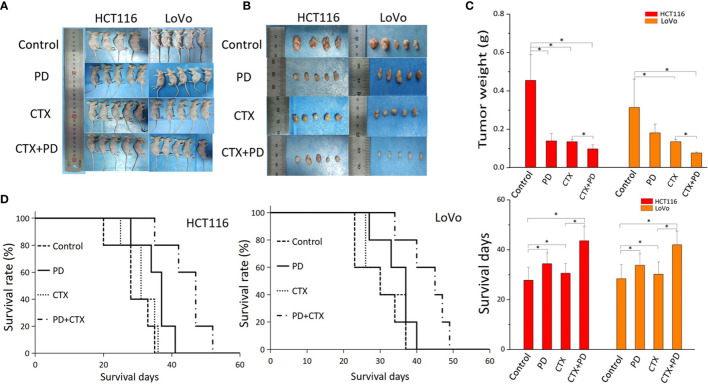
Figure 6.
The antitumor efficacy of co-treatment with PD and CTX in subcutaneous tumor models. (A) Subcutaneous tumor models of HCT116 and LoVo cells were collected after the mice were sacrificed. Each group contained five mice, but one mouse of the HCT116 control group died during the experiment. (B) After sacrifice, subcutaneous tumors were removed and photographed. (C) Tumor weight was measured using an electronic balance. The mean ± S.D. is shown. One-way ANOVA was performed used to analyze P values between groups. All groups are compared with the ‘control’ group, the ‘CTX’ group is compared with the ‘CTX+PD’ group. *P < 0.05 represents a significant difference. (D) Survival curves of each group. Survival days of other groups are compared with those of the control group; the ‘CTX’ group is compared with the ‘CTX+PD’ group. *P<0.05 represents a significant difference.

