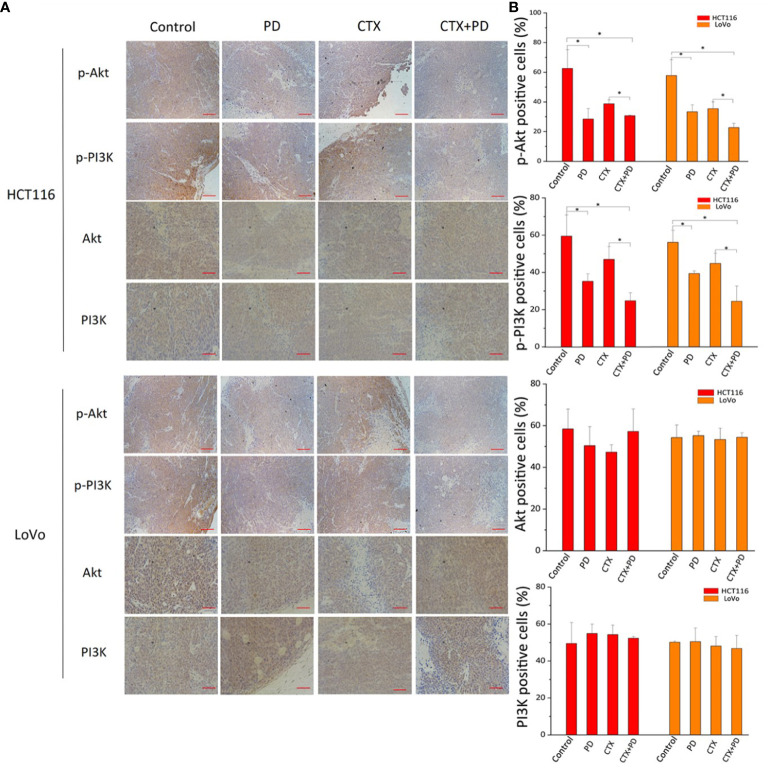
Figure 8.
Immunohistochemical analysis of PI3K and Akt in tumor tissues treated with PD and/or CTX. (A) Images of immunohistochemically stained tissues. The left column shows proteins in each tumor type. The top row shows drug treatments with different combinations. Scale bars, 100 μm. (B) Quantitation of positive staining for p-Akt, p-PI3K, Akt, and PI3K in every group. Graph of percentage of positive cells for immunohistochemical staining (three random fields). ImageJ was used to quantify the positive immunohistochemical staining results (n=3). Data are shown as the mean ± S.D. One-way ANOVA was used to analyze P values between groups. All groups are compared with the ‘Control’ group, and the ‘CTX’ group is compared with the ‘CTX+PD’ group. *P < 0.05 represents a significant difference.

