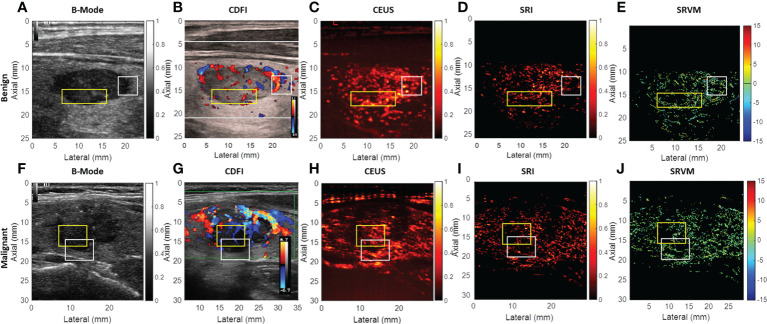
Figure 3.
US images of the representative benign and malignant thyroid nodules. (A) B-mode image of the benign thyroid nodule. (B) CDFI images show the flow within the benign thyroid nodules. (C) CEUS image shows the accumulation of microbubbles along the frames within the benign thyroid nodule. (D) SRI shows the microvasculature within the benign thyroid nodule. (E) SRVM shows the flow velocity within the benign thyroid nodule. (F) B-mode image of the malignant thyroid nodule. (G) CDFI images show the flow within the malignant thyroid nodules. (H) CEUS image shows the accumulation of microbubbles along the frames within the malignant thyroid nodule. (I) SRI shows the microvasculature within the malignant thyroid nodule. (J) SRVM shows the flow velocity within the malignant thyroid nodule.

