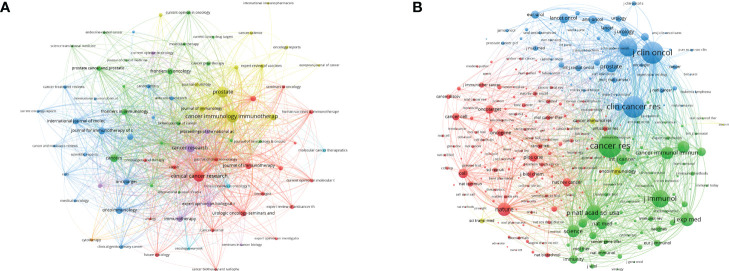
Figure 4.
The visualization network of journals (A) and co-cited journals (B) related to PCa immunotherapy. The nodes with the same color represent the same cluster, implying a close partnership. The larger the node’s size or the width of the connecting line, the closer the relative degree of co-occurrence.

