Figure 1.
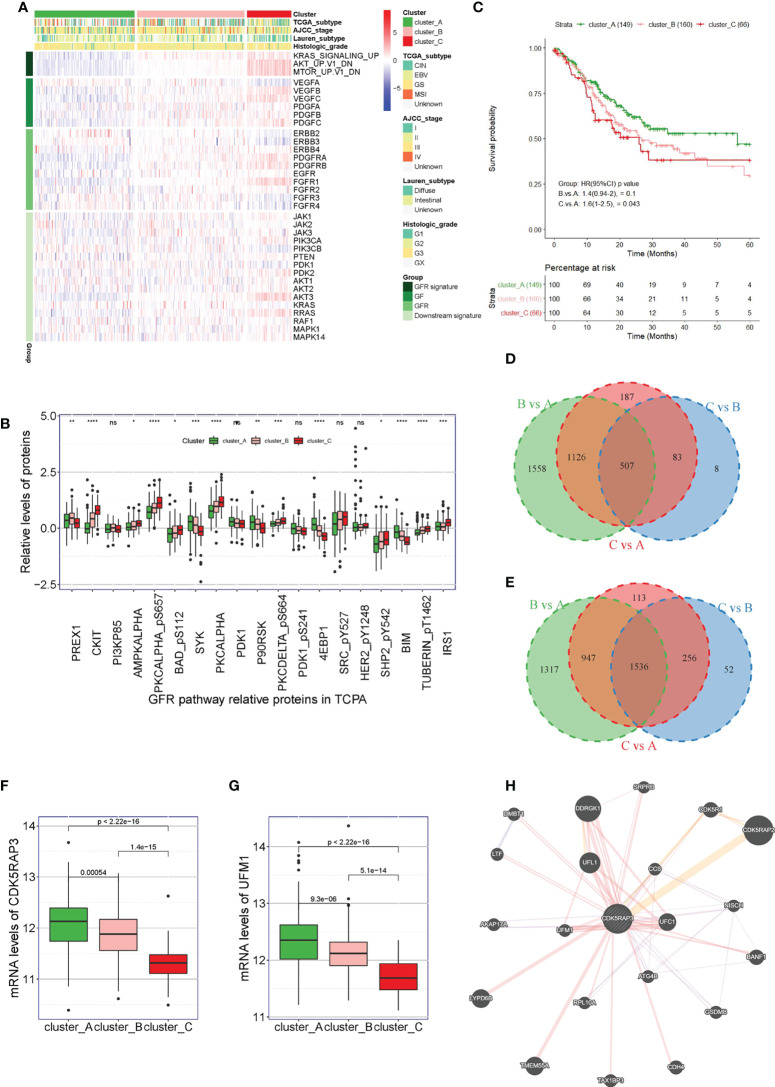
Correlation between UFM1 expression and GFR pathway and CDK5RAP3 expression. (A) Three hundred seventy-five patients in the TCGA cohort were divided into three groups (Cluster A, Cluster B and Cluster C) based on unsupervised analysis and hierarchical clustering of the ssGSEA scores of the three GFR gene sets. (B) Related proteins of the GFR pathway from the TCPA database. (C) Overall survival of patients in Cluster A, Cluster B and Cluster (C, D) Venn diagram of the common downregulated genes in clusters B vs. A, C vs. A and C vs. B. (E) Venn diagram of the common upregulated genes in clusters B vs. A, C vs. A and C vs. B. (F) mRNA levels of CDK5RAP3 in the patients in Cluster A, Cluster B and Cluster C. (G) mRNA levels of UMF1 in the patients in Cluster A, Cluster B, and Cluster C. (H) Analysis diagram of the protein interaction network (GeneMANIA). *p < 0.05; **p < 0.01; ***p < 0.001; ****p < 0.0001; ns, no significance.

