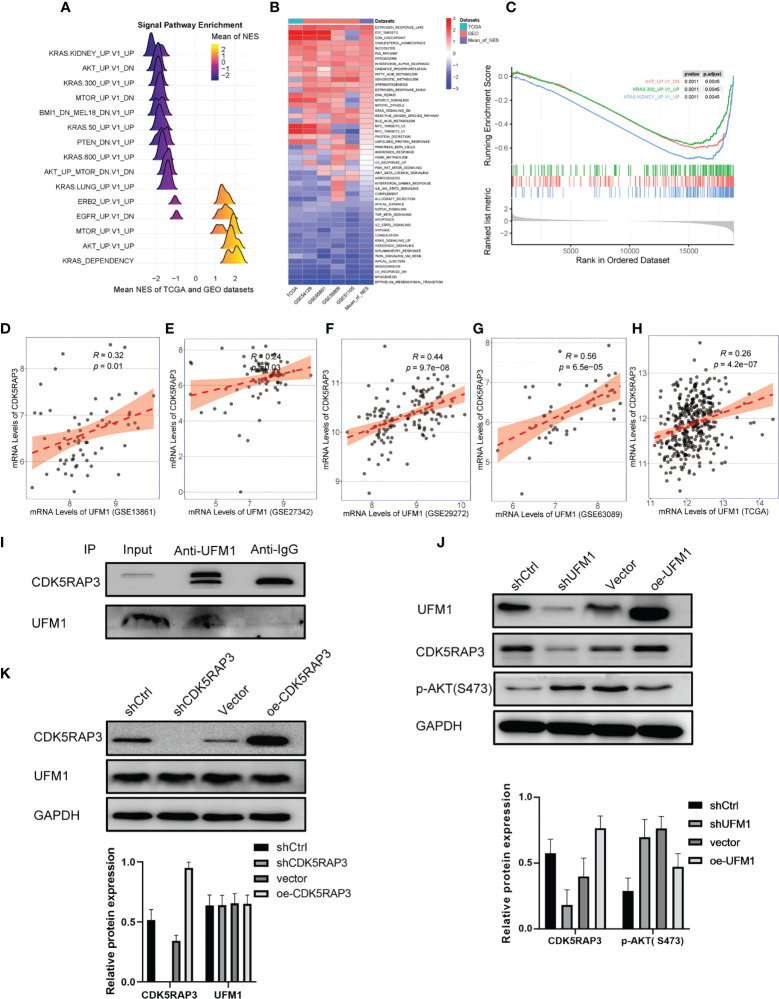
Figure 2.
Pathway enrichment analysis of CDK5RAP3 and the correlation between UFM1 and CDK5RAP3 expression. (A) Mountain map of signal pathway enrichment. (B) Heatmap showing the activation status of the biological processes in different data sets. (C) GSEA enrichment analysis map for CDK5RAP3. (D) Pearson’s correlation of UFM1 and CDK5RAP3 expression in GSE13861. (E) Pearson’s correlation of UFM1 and CDK5RAP3 expression in GSE27342. (F) Pearson’s correlation of UFM1 and CDK5RAP3 expression in GSE29272. (G) Pearson’s correlation of UFM1 and CDK5RAP3 expression in GSE63089. (H) Pearson’s correlation of UFM1 and CDK5RAP3 expression in TCGA. (I) Co-immunoprecipitation using anti-UFM1 antibody to pull down the bait protein was used to detect the binding of CDK5RAP3 and UFM1 in the overexpressing UFM1 HGC-27 cells, with input as the positive control and anti-IgG as the negative control. (J) Western blot analysis of CDK5RAP3 and PAKT with knockdown and overexpression of UMF1 in the HGC cell line. (K) Western blot analysis of UFM1 with knockdown and overexpression of CDK5RAP3 in the HGC cell line.

