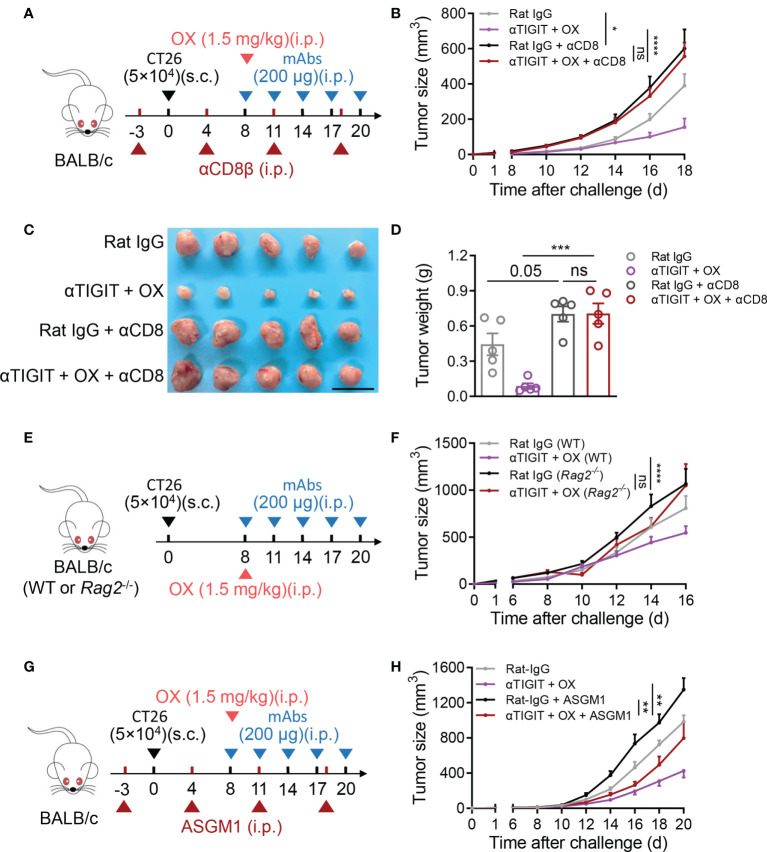
Figure 5.
Deficiency of CD8+ T cells impairs synergistic antitumor efficacy of low-dose oxaliplatin and anti-TIGIT. (A), Experimental scheme for CT26 colon cancer model used in (B–D). Mice were given injection of Rat IgG or anti-TIGIT (10 mg/kg) combined with OX (1.5 mg/kg) intraperitoneally (i.p.) at various times after injection of 5×10⁴ CT26 cells subcutaneously (s.c.) on day 0 and weekly injection of anti-CD8β mAbs intraperitoneally (i.p.) on day -3. (B), Tumor size measurement at each time point (n = 9 mice per group). (C), Representative photograph and (D) weight of tumor on day 18 after challenge. Scale bar represents 2 cm. (n = 9 mice per group). (E), Experimental scheme for CT26 colon tumor model used in (F) BALB/c WT or BALB/c Rag2-/- mice were given injection of Rat IgG or anti-TIGIT (10 mg/kg) combined with OX (1.5 mg/kg) intraperitoneally (i.p.) at various times after injection of 5×10⁴ CT26 cells subcutaneously (s.c.) on day 0. (F), Tumor size measurement at each time point (n = 9 mice per group). (G), Experimental scheme for CT26 colon tumor model used in (B) Mice were given injection of Rat IgG or anti-TIGIT (10 mg/kg) combined with OX (1.5 mg/kg) intraperitoneally (i.p.) at various times after injection of 5×10⁴ CT26 cells subcutaneously (s.c.) on day 0 and weekly injection of anti-ASGM1 intraperitoneally (i.p.) on day -3. (H), Tumor size measurement at each time point (n = 8-10 mice per group). Data were representative of at least two independent experiments. Error bars represent means ± SEM. Statistical significance was determined using two-way ANNOVA (B, F, G), one-way ANOVA followed by Tukey’s multiple-comparisons (D). ns, p > 0.05; *p < 0.05; **p < 0.01; ***p < 0.001 and ****p < 0.0001.

