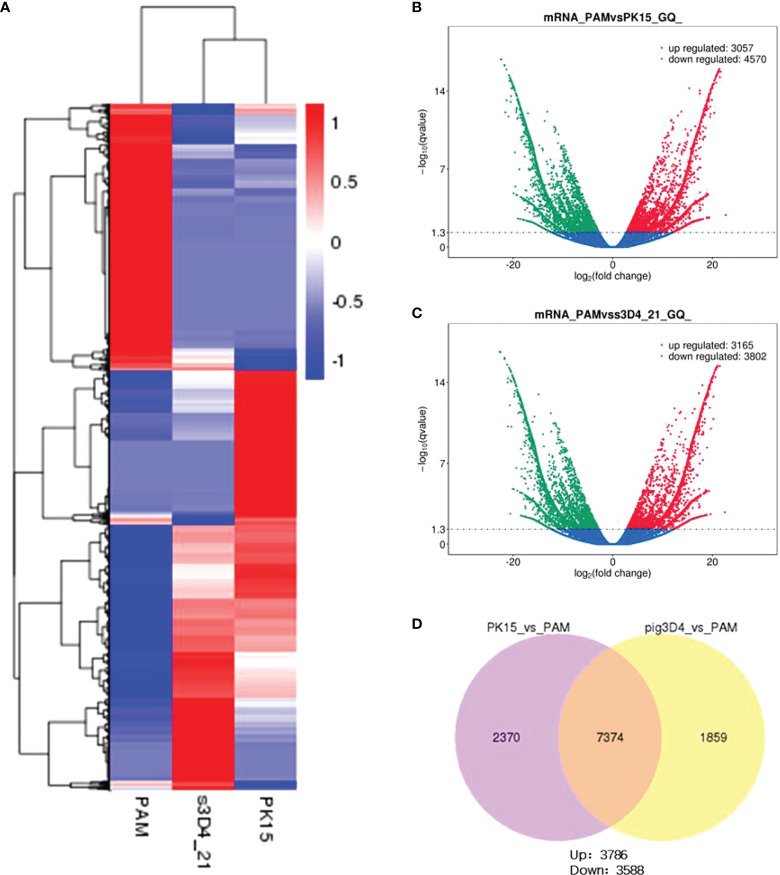
Figure 2.
Transcriptomic analysis of PAM, PK15, and 3D4-21 cells. (A) Clustering heatmap analysis of PAM, PK15, and 3D4-21 cell transcriptional profiles. (B) Volcano plot analysis of genes with differential transcriptional profiles between PAM and PK15 cells. Genes downregulated (green) and upregulated (red) by PAMs were compared with the transcriptional profile of PK15 cells, genes with no significant difference are indicated in blue. (C) Volcano plot analysis of genes with differential transcriptional profiles between PAMs and 3D4-21 cells. Genes downregulated (green) and upregulated (red) by PAMs were compared with the transcriptional profile of 3D4-21 cells, genes with no significant difference are indicated in blue. (D) Venn diagram analysis of differential genes. Venn diagram analysis was performed on the differential genes of PK15 and PAM cells and 3D4-21 and PAM cells, showing the number of common differential genes and the number of upregulated and downregulated genes.

