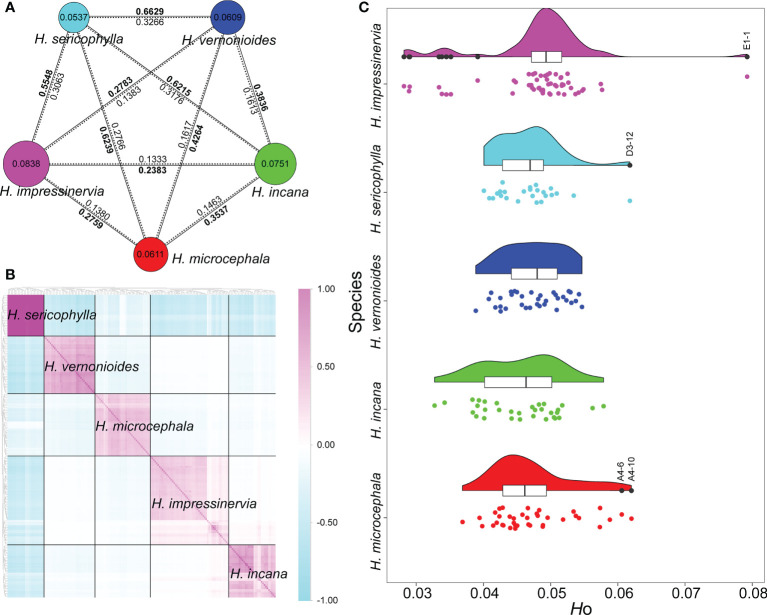
Figure 2.
Genetic diversity and genetic differentiation, kinship coefficients, and heterozygosity of Heteroplexis species. (A) The size of a circle and the value inside denote genetic diversity (π) level. Values of genetic differentiation coefficients (F ST) are in bold on the solid lines, and values of absolute sequence divergence (D XY) are on the dotted lines. (B) Intra- and interspecific identity-by-state (IBS) kinship coefficients. (C) Observed heterozygosity (Ho) of individuals.

