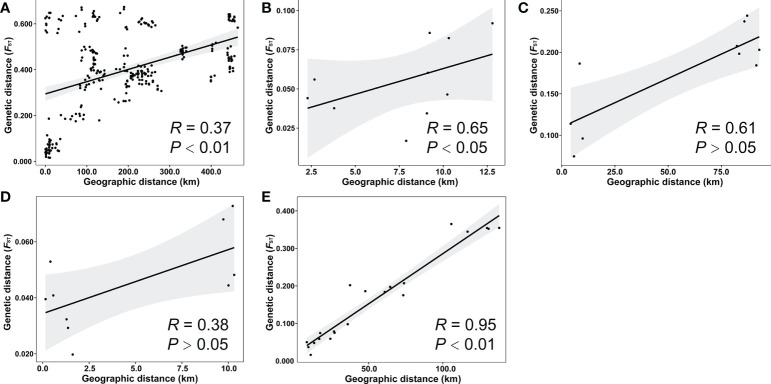
Figure 4.
Isolation by distance analysis. Mantel test of the relationship between the genetic and geographic distances among the 25 populations of all species (A), five populations of H microcephala (B), five populations of H incana (C), five populations of H vernonioides (D), and seven populations of H impressinervia (E).

