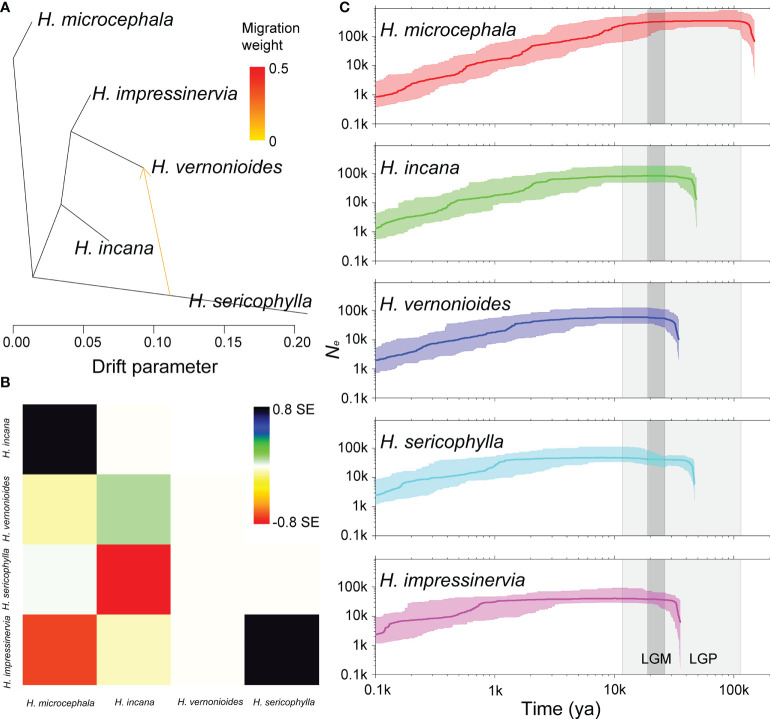
Figure 5.
Interspecific gene flow and demographic history of Heteroplexis. One gene flow event inferred by Treemix (A) and the corresponding residual plot (B). (C) Estimates of the effective population size (Ne ) using Stairway Plot. Thick and thin light lines represent the median and the 95% pseudo-confidence intervals (CIs) defined by the 2.5% and 97.5% estimations. The light and dark gray shaded areas indicate the last glacial period (LGP) and the last glacial maximum (LGM), respectively. The ya means years ago.

