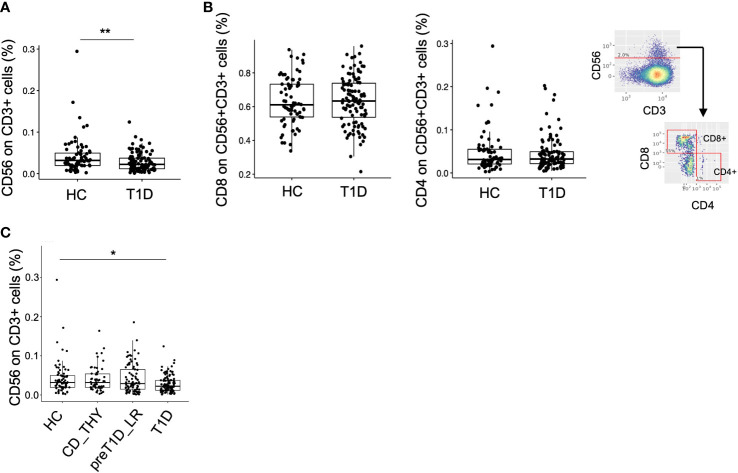
Figure 4.
Validation of the TR3-56 cell biomarker in our cohort. Frequency of CD56+CD3+ cells (namely TR3-56 cells) in HC and T1D using the semi-automated gating strategy (A). Frequency of CD8 and CD4 on TR3-56 cells and representative semi-automated gating strategy employed for the analysis. (B). Frequency of TR3-56 cells in HC, CD_THY, preT1D_LR and T1D (C). Significant differences were determined by Student’s t-test for pairwise comparisons and by Tukey post-hoc test on the linear regression model for multiple comparisons (*p < 0.05, **p < 0.01).

