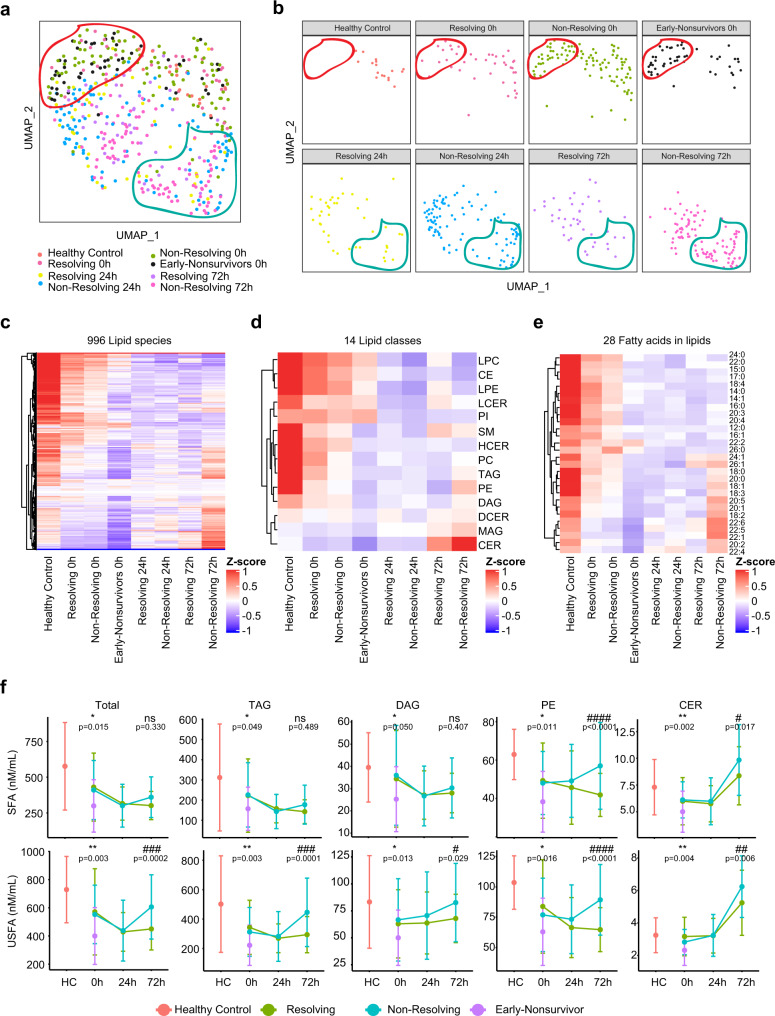
Fig. 2. Association between temporal patterns of the circulating lipidome and outcome.
Uniform Manifold Approximation and Projection (UMAP) plot shows the distribution of healthy control subjects (n = 17) and trauma patients (n = 193), grouped together (a) and separated (b) by outcome and sampling timepoints. Heatmaps show relative levels of 996 lipid species (c); 14 lipid classes (d) and 28 fatty acids labeled by carbon number: double bonds (e) for healthy subjects and trauma patients, grouped by outcome and sampling timepoints. z-score represents normalized concentrations. Rows are clustered by method of hierarchical clustering. f Quantitative comparison of circulating total lipid concentrations among healthy controls (HC) and trauma patients. Lipids are grouped by classes and fatty acids (saturated or unsaturated) identified as the acyl chains in the lipid classes. Patients are grouped by outcome and sampling timepoints. Center dots and error bars represent median value and median absolute deviation, respectively. SFA saturated fatty acid, USFA unsaturated fatty acid. Asterisks indicate statistical significance based on Kruskal–wallis test among 3 groups at 0 h with post-hoc analysis of Dunn test. The P value was adjusted by Benjamini–Hochberg method: *<0.05; **<0.01. Number sign indicates statistical significance based on 2-way AVOVA test of time-series analysis of resolving and non-resolving groups. Pairwise Comparisons were conducted by Estimated Marginal Means test. The P value was adjusted by Benjamini–Hochberg method: #<0.05; ##<0.01; ###<0.001, ####<0.0001. Source data are provided as a Source Data file.

