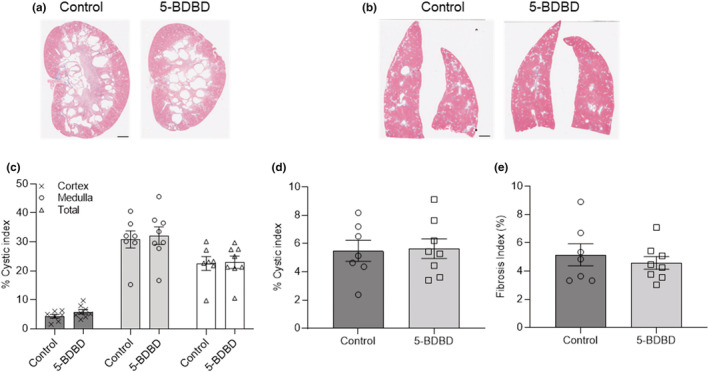
FIGURE 4.

Renal and hepatic cyst development in PCK rats treated with 5‐BDBD. (a, b) Representative images from Masson's trichrome staining for kidney (a) and liver (b) of PCK male rats treated with/without 5‐BDBD. The scale bar (2 mm) is common to all the images. (b, d) Cystic index (percentage of cystic area to cortex, medullar or total tissue slice area) of kidney (c) and liver (d) in PCK male rats treated with or without 5‐BDBD. (e) Fibrosis indexes (percentage of fibrosis area to total tissue slice area) of the liver treated with or without 5‐BDBD. Tissues from a minimum of 7 animals per group were analyzed. Data were expressed as mean ± SEM and compared using one‐way ANOVA followed by a Tukey post hoc test.
