Figure 7.

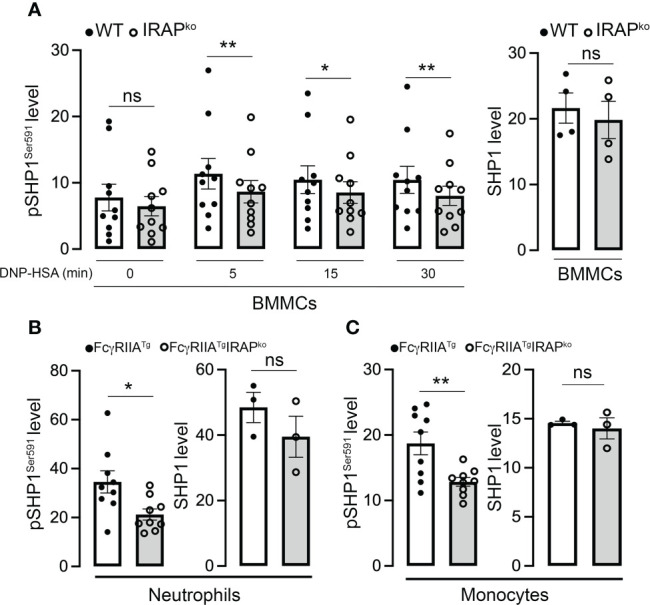
IRAP-deficient cells show less SHP1-inactivating phosphorylation on Ser591. (A) Anti-DNP IgE sensitized WT and IRAP-deficient (IRAPKO) BMMCs were stimulated with specific antigen (30 ng/mL of DNP-HSA) for indicated time points and levels of the SHP1S591 phosphorylation response were determined at indicated time points by phosflow analysis using anti-SHP1S591 (left panel). Total levels of proteins of resting cells were analyzed using anti-SHP1 (right panel). (B, C) SHP1 phosphorylation on Ser591 was also determined on IgG-stimulated neutrophils (B) and monocytes (C) during ASA analyzed ex vivo using phosflow analysis. Cells were accessed directly from the blood 5 min after initiation of ASA. The gating strategies for analysis of BMMCs, neutrophils and monocytes and representative examples of Ab staining are shown, respectively in ( Supplementary Figures 2B, C ). Phosphorylation levels in (A–C) were determined as the ratio of the gMFI of samples divided by the gMFI of the Isotype of the respective sample and represent the mean ± s.e.m of indicated experiments. Statistical analysis was done using a Student’s test. *: P < 0.05; **: P < 0.01; ns, not significant.
